
Figure 5.
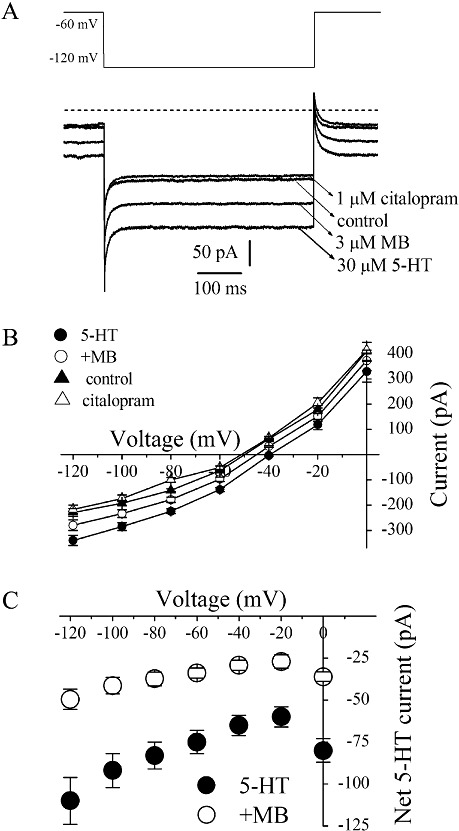
MB inhibits the hSERT mediated 5-HT induced currents in EM4 cells. (A) 5-HT (30 µM)-induced whole-cell currents recorded in EM4 cells in the absence and presence of citalopram (1 µM) or MB (3 µM). (B) Steady-state current–voltage (I–V) curves for 5-HT-induced currents in hSERT-transfected EM4 cells. Citalopram (1 µM) was added to 5-HT to test for inhibitor sensitivity. Symbols represent the means ± SEM of five experiments. The background I–V curves were obtained under control conditions (no 5-HT, no inhibitor). The steps to the test voltages from the holding potential of −60 mV lasted 500 ms. Steady-state current was defined as the average current during 400–500 ms The membrane potential was held at −60 mV, and then the voltage was stepped to a potential between −120 and 0 mV in 20 mV increments. (C) Subtracted cumulative data for net 5-HT-induced steady-state currents. The difference currents in controls (5-HT-CON) and after MB (3 µM; 10 min) treatment (MB-CON) illustrated in Figure 4A are plotted against the test voltage. Values are means ± SEM, n= 5.