
Figure 6.
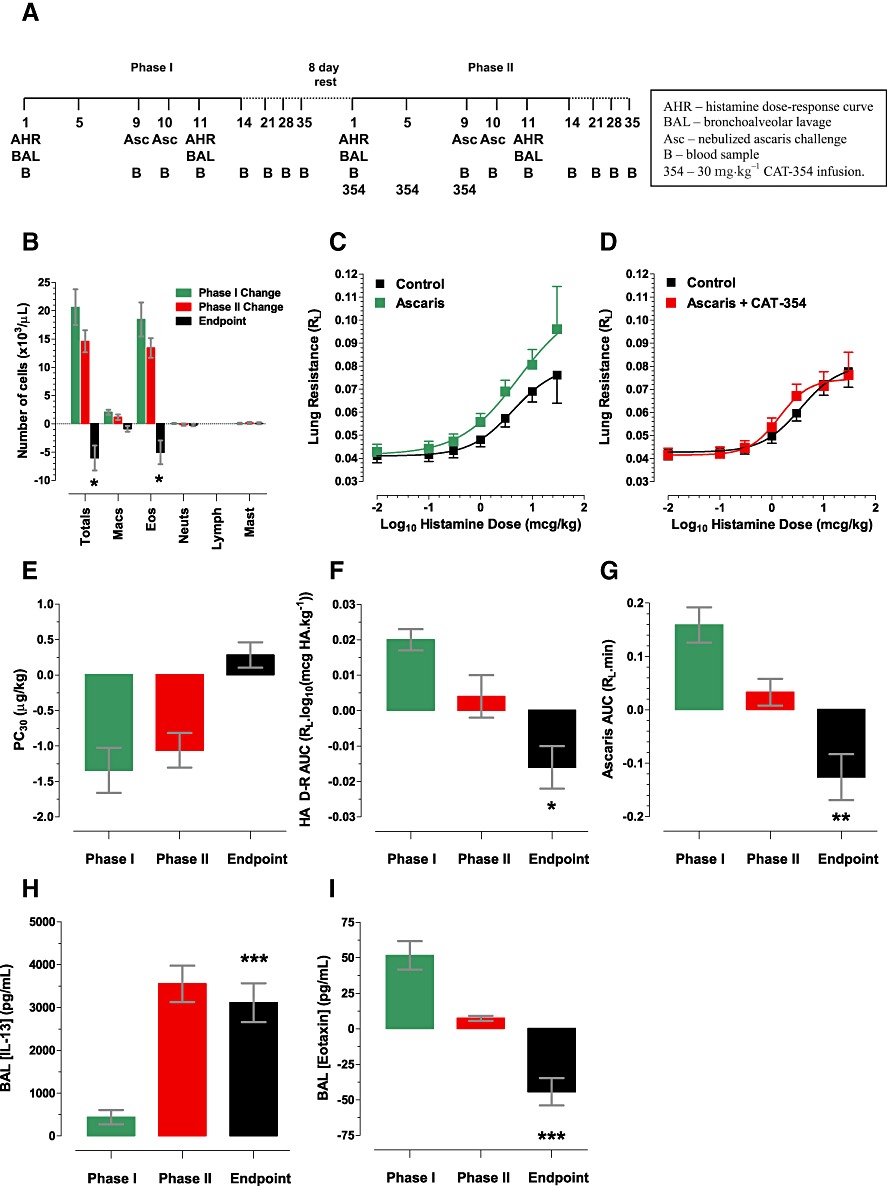
CAT-354 decreases AHR and eosinophilia in a cynomolgus model of antigen challenge. (A) Model schematic. (B) BAL inflammation (n= 21). (C) Histamine AHR in phase I (n= 18) and (D) Phase II (n= 18). (E) Histamine PC30 (n= 18). (F) Histamine AHR by RL AUC (n= 14). (G) Antigen priming (n= 20). (H) BAL IL-13 (n= 22). (I) BAL eotaxin (n= 22). Data displayed as the arithmetic mean ± SEM of individual animal changes at day 11 compared with day 1 for the phase I and II changes, respectively and phase II compared with phase I in the endpoint column. Statistical testing was performed only on the endpoint and was a two-way Student's t-test with the null hypothesis that the endpoint contained the number zero. *P < 0.05; **P < 0.01; ***P < 0.001.