
Figure 1.
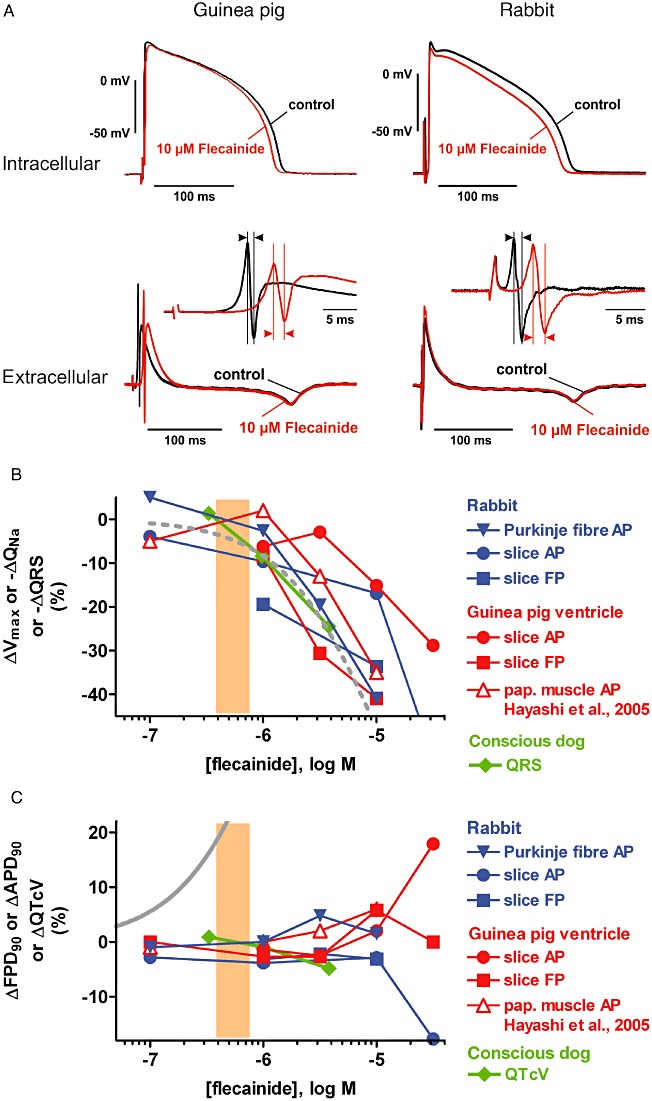
(A) Examples of intracellular (AP) and extracellular (FP) recordings from guinea pig (left) and rabbit (right) ventricular slices. Shown are superimposed tracings before (pre-drug control) and following flecainide exposure (10 µM). Insets: enlarged view of primary and secondary peak of the FP, the latency difference of which is a measure of Na+ conductance (QNa). (B) Concentration-dependence of effects of flecainide on ΔVmax, ΔQNa and ΔQRS in the following preparations: rabbit Purkinje fibre and ventricular slices, guinea pig ventricular slices and papillary muscle (data from Hayashi et al., 2005) and conscious dog. Also depicted is a concentration–response curve for inhibition of the hNav1.5 Na+ current (dashed grey line) and the range of therapeutically effective protein-unbound drug plasma concentrations in humans (orange area; data from Redfern et al., 2003). Please note that throughout all figures (i) solid symbols reflect data originating from the authors' laboratories, whereas data from the literature are depicted with unfilled symbols; and (ii) only mean values are depicted for clarity. (C) Concentration-dependence of effects of flecainide on ΔAPD90, ΔFPD90 and ΔQTcV in the following preparations: rabbit Purkinje fibre and ventricular slices, guinea pig ventricular slices and papillary muscle (data from Hayashi et al., 2005) and conscious dog. Also depicted is a concentration–response curve for inhibition of the hERG K+ current (solid grey line) and the range of therapeutically effective protein-unbound drug plasma concentrations in humans (orange area; data from Redfern et al., 2003).