
Figure 7.
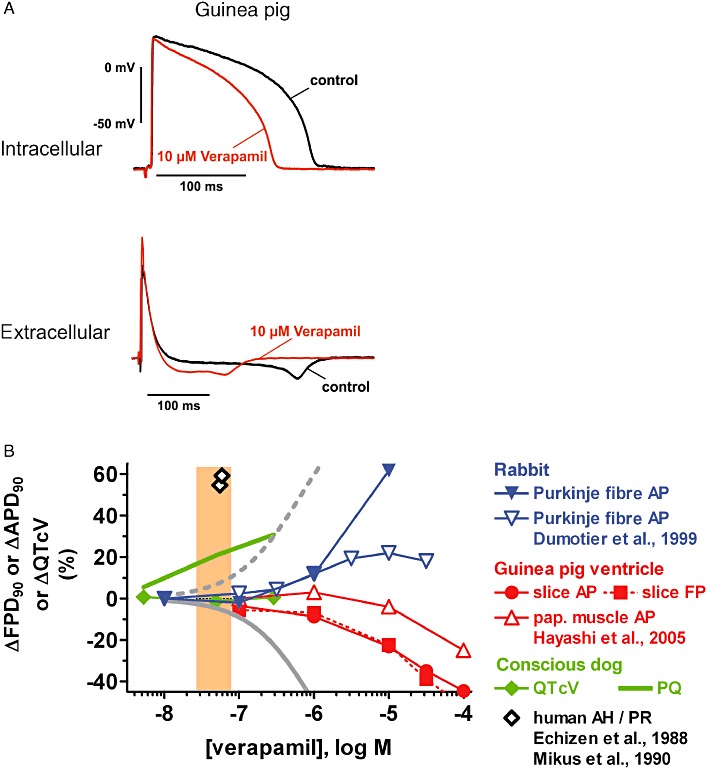
(A) Examples of intracellular (AP) and extracellular (FP) recordings from guinea pig ventricular slices. Shown are superimposed tracings before (pre-drug control) and following verapamil exposure (10 µM). (B) Concentration-dependence of effects of verapamil on ΔAPD90, ΔFPD90 and ΔQTcV in the following preparations: rabbit Purkinje fibre (own data and data from Dumotier et al., 1999), guinea pig ventricular slices and papillary muscle (data from Hayashi et al., 2005), conscious dog and human subjects (Echizen et al., 1988; Mikus et al., 1990). Also depicted are concentration–response curves for inhibition of the hERG K+ current (dashed grey line) and the L-type Ca2+ current (from Zhang et al., 1999) and the range of therapeutically effective protein-unbound drug plasma concentrations in humans (orange area; data from Redfern et al., 2003).