
Figure 4.
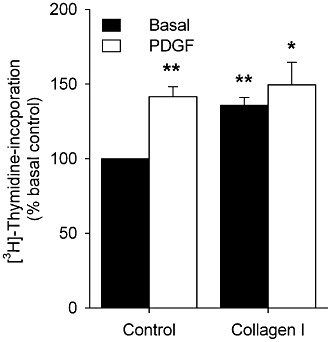
DNA synthesis of intact HTSM tissue in the presence of medium (basal control), PDGF (10 ng·mL−1), collagen I (50 µg·mL−1) or the combination of both. Data represent means ± SEM of five experiments performed in triplicate. *P < 0.05, **P < 0.01 compared with basal control.