
Figure 2.
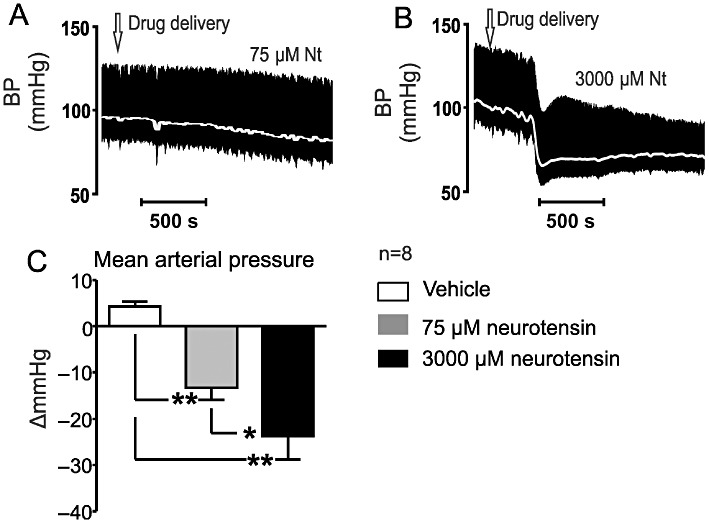
(A and B) Effects of i.t. applied neurotensin (75 and 3000 µM) on MAP (grey; pulsatile arterial pressure, black). (C) Grouped data of i.t. applied neurotensin (75 and 3000 µM) on MAP. *P < 0.01, **P < 0.001.
Official websites use .gov
A
.gov website belongs to an official
government organization in the United States.
Secure .gov websites use HTTPS
A lock (
) or https:// means you've safely
connected to the .gov website. Share sensitive
information only on official, secure websites.
(A and B) Effects of i.t. applied neurotensin (75 and 3000 µM) on MAP (grey; pulsatile arterial pressure, black). (C) Grouped data of i.t. applied neurotensin (75 and 3000 µM) on MAP. *P < 0.01, **P < 0.001.