
Fig. 9.
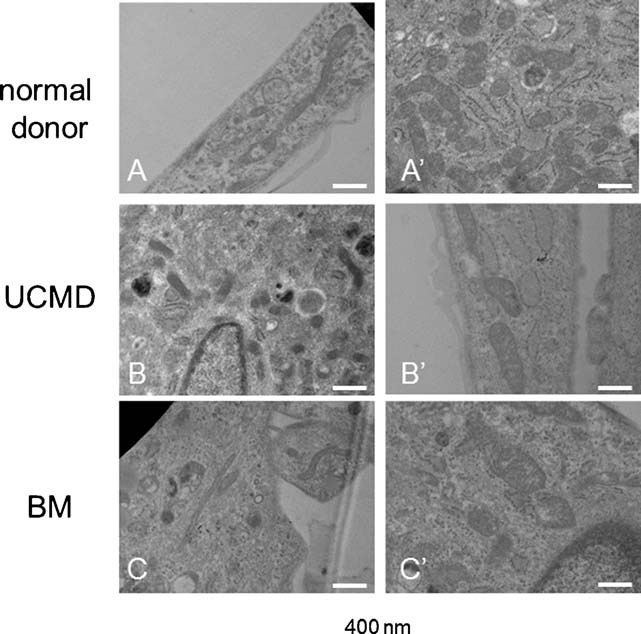
Transmission electron microscopy analysis of Epon-embedded cell cultures from BM and UCMD patients at different culture passage. At low passage number (A–C), altered mitochondria characterized by reduced short axis are visible in both UCMD and BM patient cultures (arrows). At high passages, the mitochondria of both patients show a morphology very similar to that of normal control. Scale bar, 400 nm.