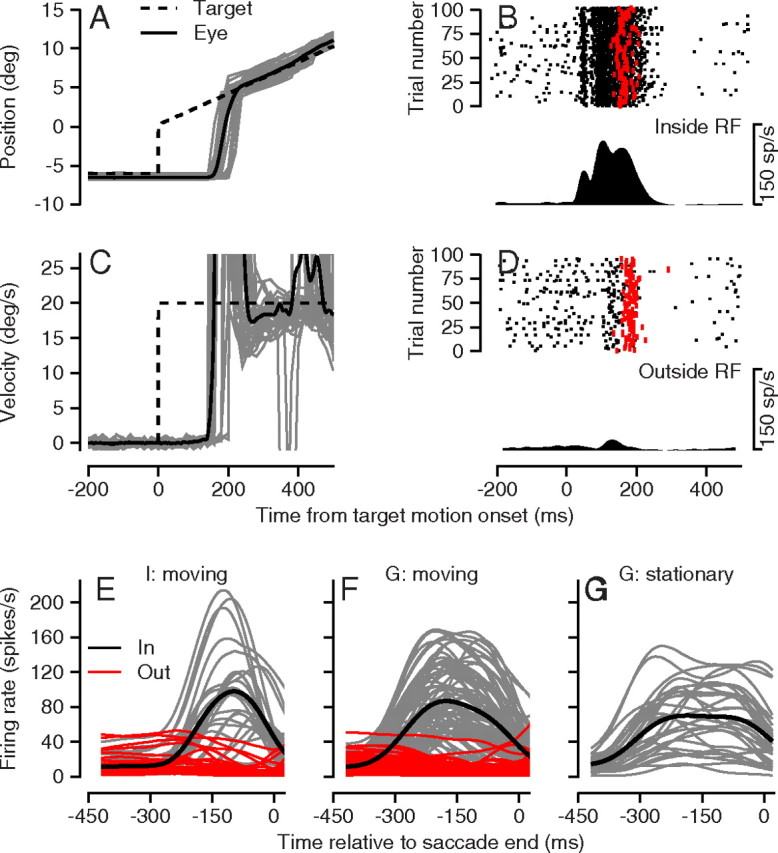
Figure 2.

Eye movements and neural activity from a representative experiment and summaries of average neural responses of the sample population. A, C, Continuous and dashed traces show eye and target position (A) and velocity (C) along the direction of target motion as a function of time relative to the start of target motion. The bold traces show averages across trials, and the thin traces show responses on a sample of single trials. B, D, Rasters show neural activity for trials with a target inside (B) or outside (D) the receptive field. Each black dot on the raster is a spike, and each red dot is the start of a saccade. The PSTH below each raster depicts the average firing rate for the raster. E–G, Each thin trace shows the PSTH for a different neuron, and the trace in each panel is the average of the thin traces. All traces were constructed after aligning the single trial data on the end of the saccade. E, Pursuit task for monkey I. F, Pursuit task for monkey G. G, Saccade task for monkey G. In E and F, the black and red traces show averages of firing rate for targets that appeared inside versus outside the receptive field of the neuron under study.
