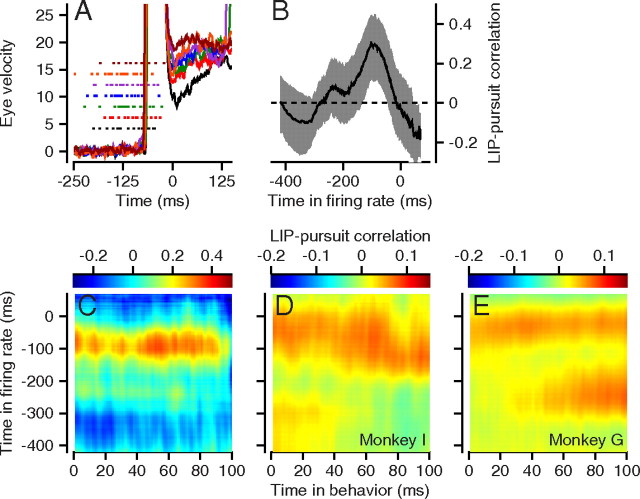
Figure 3.
LIP–pursuit correlations for an example experiment and across experiments. A, Traces show eye velocities from single trials and dots are the spike times for the same trials. The colors indicate behavioral and neural data taken at the same time. B, The bold trace is the correlation between neural activity at the time indicated on the x-axis and the average postsaccadic pursuit speed from 20 to 60 ms after the end of the saccade. The surrounding gray ribbon shows the bootstrapped 95% confidence limits. C, The color of each pixel in the image gives the LIP–pursuit partial correlation for firing rate and eye velocity for the pair of times indicated by the x- and y-coordinates of the pixel. D, E, Average LIP–pursuit correlation maps across neurons in each monkey, configured as described for C.

