Figure 4.
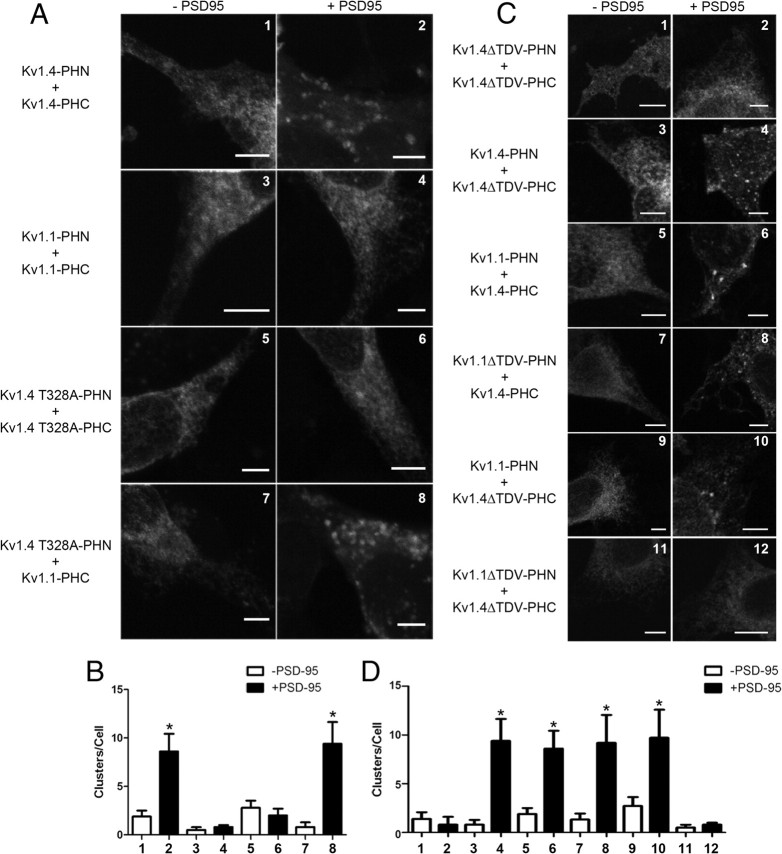
Bimolecular fluorescent complementation can be used to monitor different populations of channel heteromers within the cell based on protein compartmentalization. A, Representative confocal images of COS-7 cells transfected with Kv1.4-PHN plus Kv1.4-PHC (1, 2), Kv1.1-PHN plus Kv1.1-PHC (3, 4), Kv1.4 T328A-PHN plus Kv1.4 T328A-PHC (5, 6), or Kv1.4 T328A-PHN plus Kv1.1-PHC (7, 8) either in the absence (left column, −PSD95) or presence (right column, +PSD95) of PSD95. Scale bars, 5 μm. B, Bar graph showing quantification of number of channel clusters per cell for conditions shown in frames 1–8 (n = 3–6 for each condition). Conditions were compared using one-way ANOVA followed by Tukey's posttest. *p < 0.05 when compared with the minus PSD-95 control. C, Representative confocal images of COS-7 cells transfected with Kv1.4ΔTDV-PHN plus Kv1.4Δ-PHC (1, 2), Kv1.4-PHN plus Kv1.4ΔTDV-PHC (3, 4), Kv1.1-PHN plus Kv1.4-PHC (5, 6), Kv1.1 ΔTDV-PHN plus Kv1.4-PHC (7, 8), Kv1.1-PHN plus Kv1.4ΔTDV-PHC (9, 10), or Kv1.1ΔTDV-PHN plus Kv1.4ΔTDV-PHC (11, 12) either in the absence (left column, −PSD95) or presence (right column, +PSD95) of PSD95. Scale bars, 5 μm. D, Bar graph showing quantification of number of channel clusters per cell for conditions shown in frames 1–12 (n = 4–10 for each condition). Conditions were compared using one-way ANOVA followed by Tukey's posttest. *p < 0.05 when compared with the −PSD-95 control. Error bars indicate SEM.

