Figure 6.
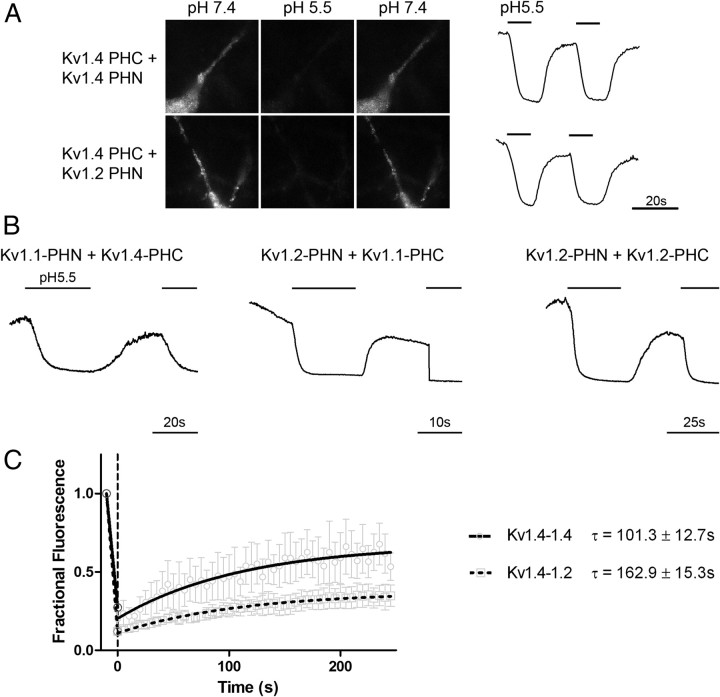
Cell surface Kv channel complexes composed of different α-subunits exhibit unique localization and dynamics. A, Kv channel surface localization is revealed using acid quenching of surface fluorophore in hippocampal neurons. Representative images of neurons transfected with either Kv1.4-PHN plus Kv1.4-PHC (top) or Kv1.4-PHC plus Kv1.2-PHN (bottom) are shown at neutral pH 7.4 (left), after addition of solution at pH 5.5 (middle) or after returning to neutral pH (right). Representative traces demonstrate quenching of cell surface fluorophore at pH 5.5 (thick bar), which returns to baseline upon addition of solution at pH 7.4. Calibration: 20 s. B, Acid quenching traces shown for hippocampal neurons transfected with Kv1.4–1.1 (left), Kv1.2–1.1 (middle), or Kv1.2–1.2 (right). The bars above trace represent timing of application of pH 5.5 medium. Calibration: 20, 10, and 25 s, respectively. C, Fluorescence recovery after photobleaching reveals different mobilities of homomeric and heteromeric Kv channels. Hippocampal neurons were transfected with either Kv1.4-PHC plus Kv1.4-PHN or Kv1.4-PHC plus Kv1.2-PHN and live imaged on a confocal microscope as described in Materials and Methods. A region of interest was irreversibly bleached using high-intensity laser light and recovery of fluorescent protein back into the region of interest was measured over time. Recoveries were fit to a single exponential equation. Kv1.4–Kv1.4 homomers (solid line, circles) display a more rapid recovery into the region of interest than is seen with Kv1.4–Kv1.2 heteromeric channels (dotted line, squares) (τ = 101.3 ± 12.7 s for Kv1.4–Kv1.4 vs 162.9 ± 15.3 s for Kv1.4–Kv1.2; n = 6 for both conditions; p = 0.01 by two-tailed t test).

