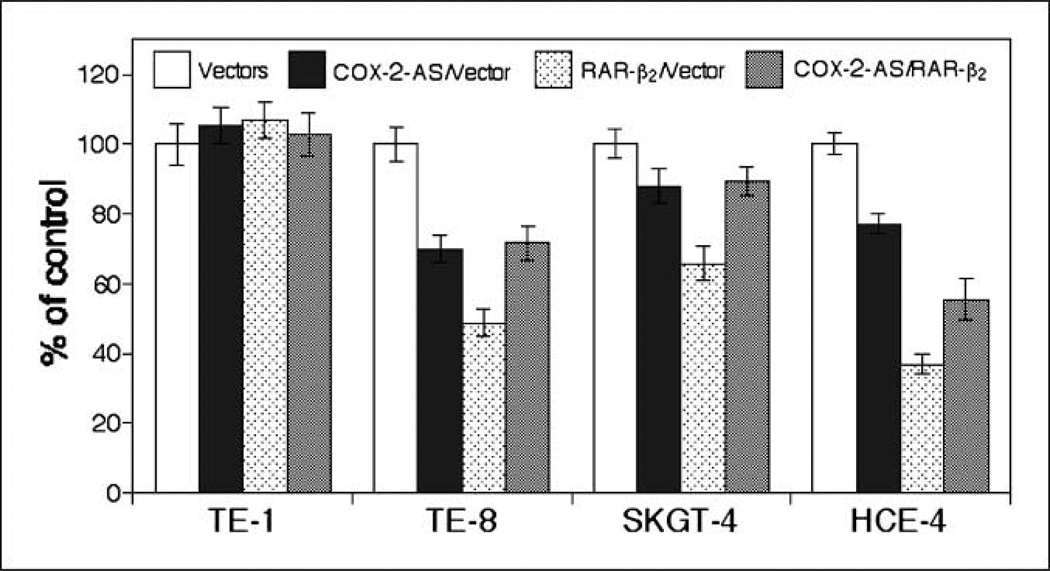
Fig. 5.
Antisense COX-2–antagonized RAR-β2 effects in esophageal cancer cell lines. Esophageal cancer cell lines TE-1, TE-8, HCE-4, and SKGT-4 were first transfected with pCMS/EGFP vector plus pcDNA3.1 vector or pCMS/EGFP plus pcDNA3.1/COX2-AS. Two days later, GFP was expressed in these cells. We then transfected RAR-β2 expression vector into these tumor cells for 48 h. After that, the cells were stained for Ki67 immunohistochemically. More than 200 cells in 10 fields of 20× objective were counted for positive staining of GFP (green) as well as for positive or negative Ki67 (red) staining in these cells. The percentage of control of cell proliferation was calculated from the following equation: %control = NT/NV × 100, where NT and NV are the numbers of Ki67-positive cells in GFP-positive cells of COX-2 antisense–transfected or RAR-β2–transfected and control cultures, respectively.

