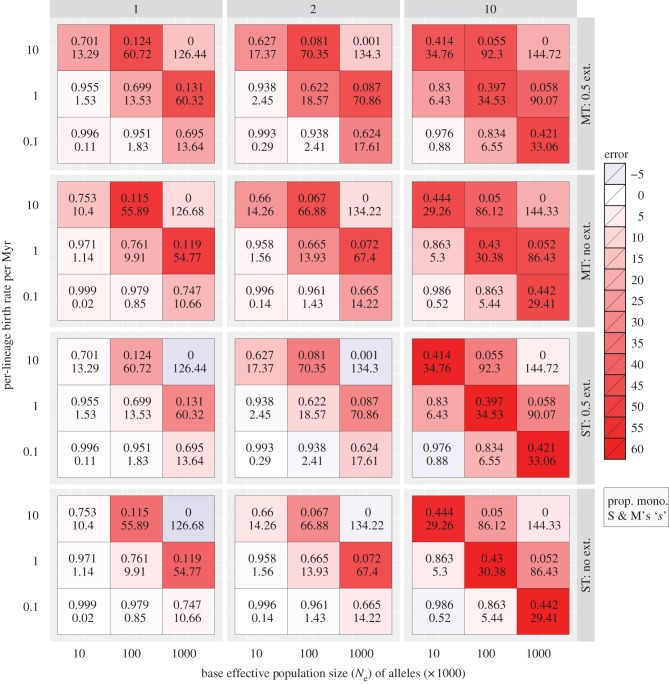
Figure 1.
A heat map showing errors in the estimated number of species derived from GMYC species delimitation on simulated gene trees. Columns labelled 1, 2 and 10 indicate the magnitude of interspecific variation in Ne (i.e. zero, twofold and tenfold variation); rows are arranged by the model used (single-threshold, ST; or multiple-threshold, MT), and the presence (0.5 ext.) or absence of extinction (no ext.). Numbers inside cells indicate the average proportion of monophyletic species (upper) and Slatkin & Maddison's ‘s’ (lower) in simulated trees.

