
Figure 1.
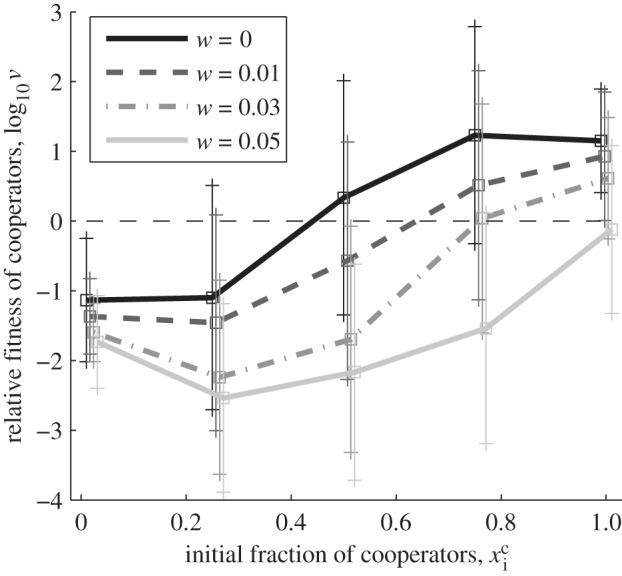
Relative fitness of cooperators across different starting frequencies, for increasing cost of cooperation w (see §3a and the electronic supplementary material, S2). Cooperators demonstrate positive frequency-dependent selection. The curve is shifted to the right as the cost of cooperation increases, i.e. higher initial frequencies of cooperators are required to maintain cooperation. Parameter values: b1 = 0.2b0 (except in the w = 0 curve, where b1 = 0), q = 0, μV = 0, μcd = μH = 10−5 h−1, b0 = 1 h−1, K = b0/c = 106 ml−1, p = 10−6 ml h−1, y = 50, d = 0.2 h−1, volume = 1 ml, final time tf = 100 h, statistics over 200 runs per parameter set. Initial conditions: Va = 106 ml−1, Ca+ Da = 103 ml−1, VA = CA = DA = 0.