
Figure 4.
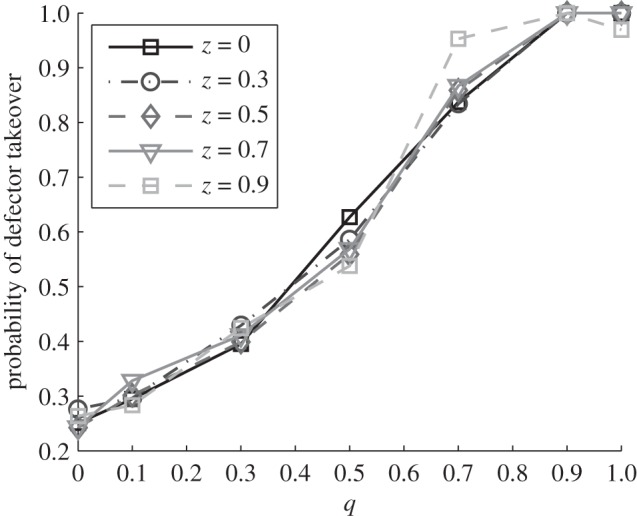
Probability of defector takeover across the MA–GFG continuum (MA q = 0, GFG q = 1) in the full coevolution and cooperation model (see §§2c and 3c) for different costs of generalism z. We plot the fraction of runs where defectors grow to be more than 99 per cent of the initially cooperator-only host population, within a 2000 h time window of observation and subject to non-extinction of the system (more than 85% of runs are stable in this case). Parameter values are pg = 0.01 p, w = 0.2 h−1, K = b0/c = 106 ml−1, b1 = 0.2 b0, μV = μH = μcd = 10−5 h−1, 1000 runs per set, other parameters as in figure 2. Initial conditions: Va = 106 ml−1, Ca = 102 ml−1, VA = CA = Da = DA = 0. Cooperation is maintained for longer times under a MA model of specificity.