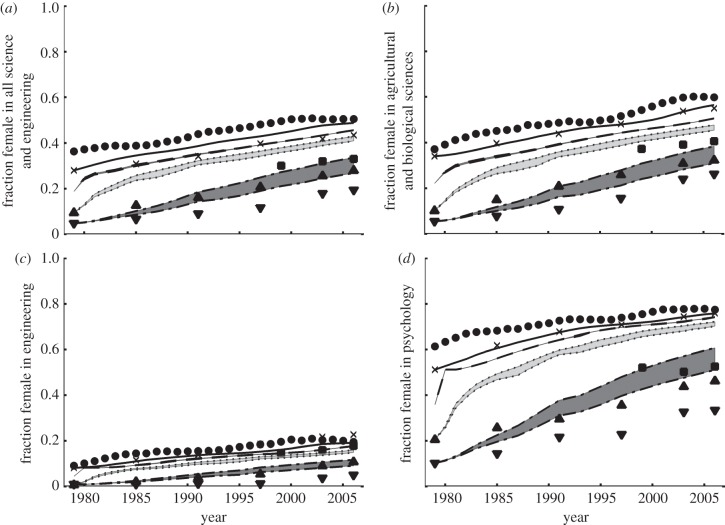
Figure 2.
Comparison of female participation (female academics as a percentage of the academic population) as predicted under a null model (lines: solid lines, graduate; dashed lines, post-doctorate; dotted lines, assistant professor; dash-dotted lines, tenured professor) versus actual NSF data (symbols: circles, undergraduate; cross symbols, graduate; squares, post-doctorate; triangles, assistant professor; inverted triangles, tenured professor) for (a) all of science and engineering, (b) agricultural and biological sciences, (c) engineering, and (d) psychology. Shaded areas reflect the variation in model output under slightly different model structures (see text for details).

