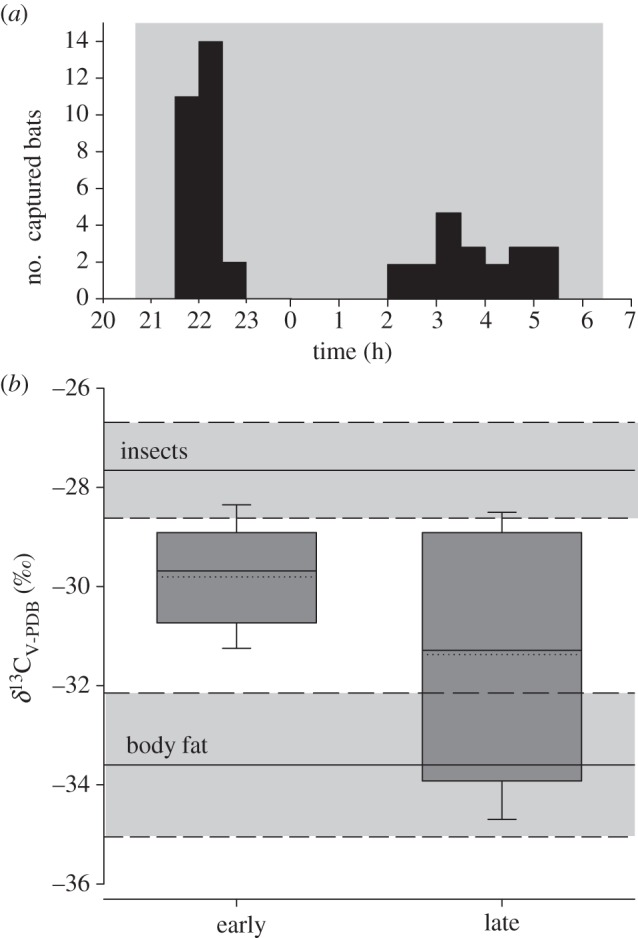
Figure 1.

(a) Distribution of capture events in migratory Pipistrellus nathusii (grey-shaded area indicates the onset and end of night) and (b) stable carbon isotope ratios of exhaled breath (δ13CV-PDB; ‰) in bats that were captured during the evening peak (21.30 until 23.00 h) and the morning peak (2.00 until 5.30 h). Box margins indicate the 25 and 75 percentiles, whiskers the 5 and 95 percentiles, solid lines within the boxes the median and the dotted lines within the boxes the mean values. Horizontal grey boxes describe the δ13CV-PDB of potential energy sources, i.e. insects and body fat (solid horizontal line = mean value; dashed horizontal line = ±1 s.d.).
