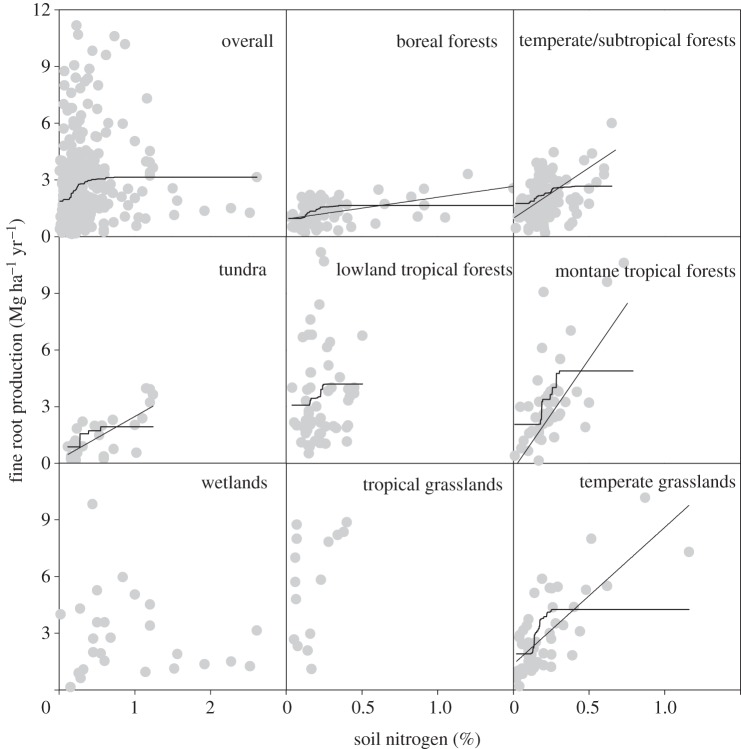
Figure 1.
The relationships between fine root production (Mg ha−1 yr−1) and soil nitrogen concentration (%). Regression lines were plotted with p < 0.05: boreal forests (r2 = 0.200, p < 0.001, n = 76), temperate/subtropical forests (r2 = 0.161, p < 0.001, n = 104), lowland tropical forests (r2 = 0.027, p = 0.218, n = 59), montane tropical forests (r2 = 0.473, p < 0.001, n = 45), temperate grasslands (r2 = 0.454, p < 0.001, n = 51), tropical grasslands/savannah (r2 = 0.226, p = 0.054, n = 17), tundra (r2 = 0.487, p < 0.001, n = 27) and wetlands (r2 = 0.010, p = 0.633, n = 26). The curved lines indicate the predicted values from monotonically fitted models using boosted regression tree (BRT) analysis. Owing to the small sample size, BRT was not performed for tropical grasslands and wetlands.

