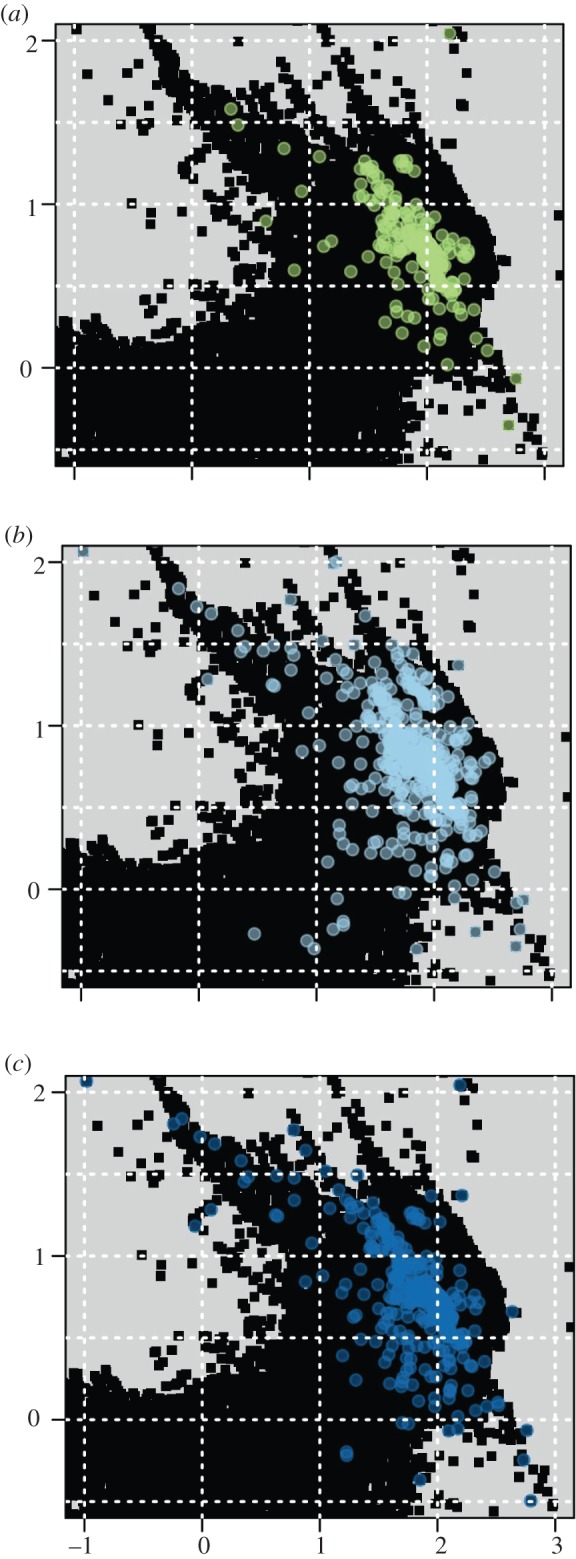
Figure 2.

The environmental niche of the three trophic groups shown in the gridded environmental space of the PCA (the first principal components are on the x-axis and the second on the y-axis). The black squares illustrate the available environment. The environmental space occupied by each trophic group is shown in the following panels: (a) herbivores, (b) omnivores, and (c) planktivores.
