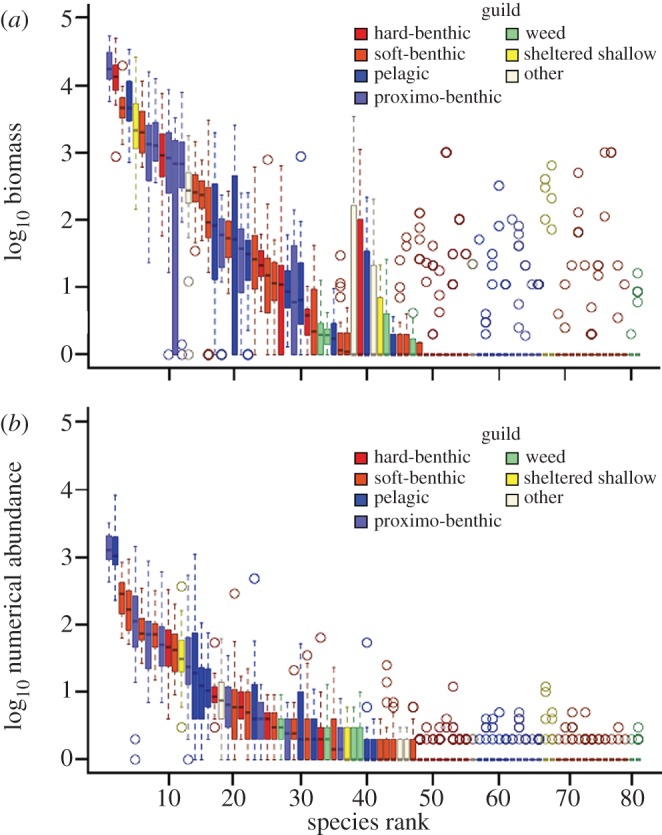
Figure 4.

Rank abundance plots of (a) biomass and (b) numerical abundance. Box plots show median, interquartile range, range and outlier values for each species over the three decades of the survey. Species are ranked by (first) median and (second) upper quartile. Guilds are colour coded.
