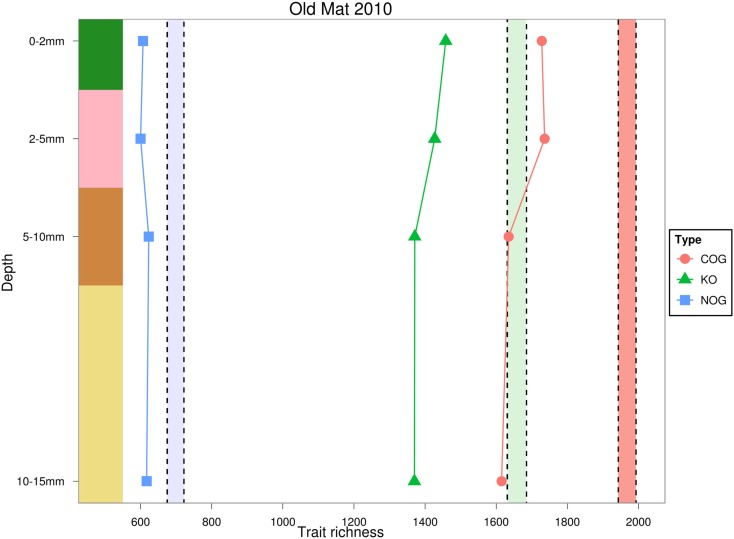
Figure 7.
Estimated rarefied trait richness in the OM-10 core using three different orthologous gene annotations. Values falling below or above their similarly colored shaded regions indicate significantly fewer (α = 0.05) or greater trait richness than expected under 1,000 null model randomizations, respectively.

