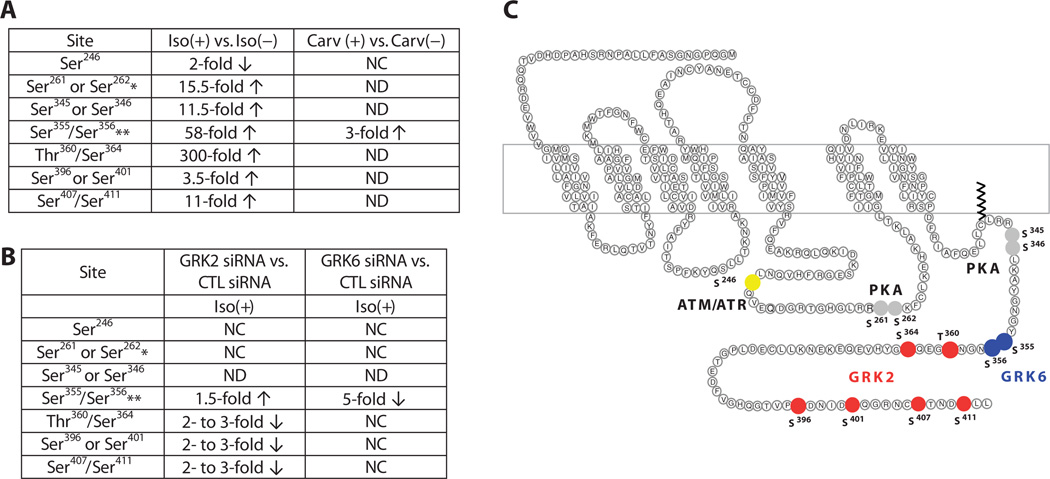
Fig. 4.
Quantitative analysis of β2AR phosphorylation. (A) Summary of phosphorylation changes in response to agonist stimulation as determined by quantitative LC-MS/MS. HEK293 cells stably transfected with the β2AR were treated with 10 µM isoproterenol (Iso) or carvedilol (Carv) for 5 min before harvesting. Fold changes in phosphorylation were calculated relative to samples without agonist treatment. *, singly phosphorylated peptides were detected when either one of the listed sites was phosphorylated; **, the listed two sites were identified as a cluster when both sites were phosphorylated; CTL, control; NC, no change; ND, not detected. (B) Summary of phosphorylation changes in response to GRK2 or GRK6 knock-down as determined by quantitative LC-MS/MS. GRK2 siRNA or GRK6 siRNA was used to knock down the individual kinases in HEK293 cells stably transfected with the β2AR. Fold changes were calculated relative to samples with CTL siRNA treatment. Both GRK siRNA– and CTL siRNA–treated cells were stimulated with 10 µM isoproterenol for 5 min before harvesting. (C) Mapping GRK2 and GRK6 phosphorylation sites on the β2AR. GRKs responsible for phosphorylation of individual residues were determined by siRNA treatment combined with quantitative MS. Significant fold changes of the phosphorylated residue clusters are shown and indicated by filled circles. Residues that exhibited a decrease in the extent of phosphorylation upon GRK2 knockdown are indicated in red and those that exhibited a decreasewithGRK6 knockdown are shown in blue. PKA consensus sites are shown in gray and the site phosphorylated by ATM is shown in yellow.

