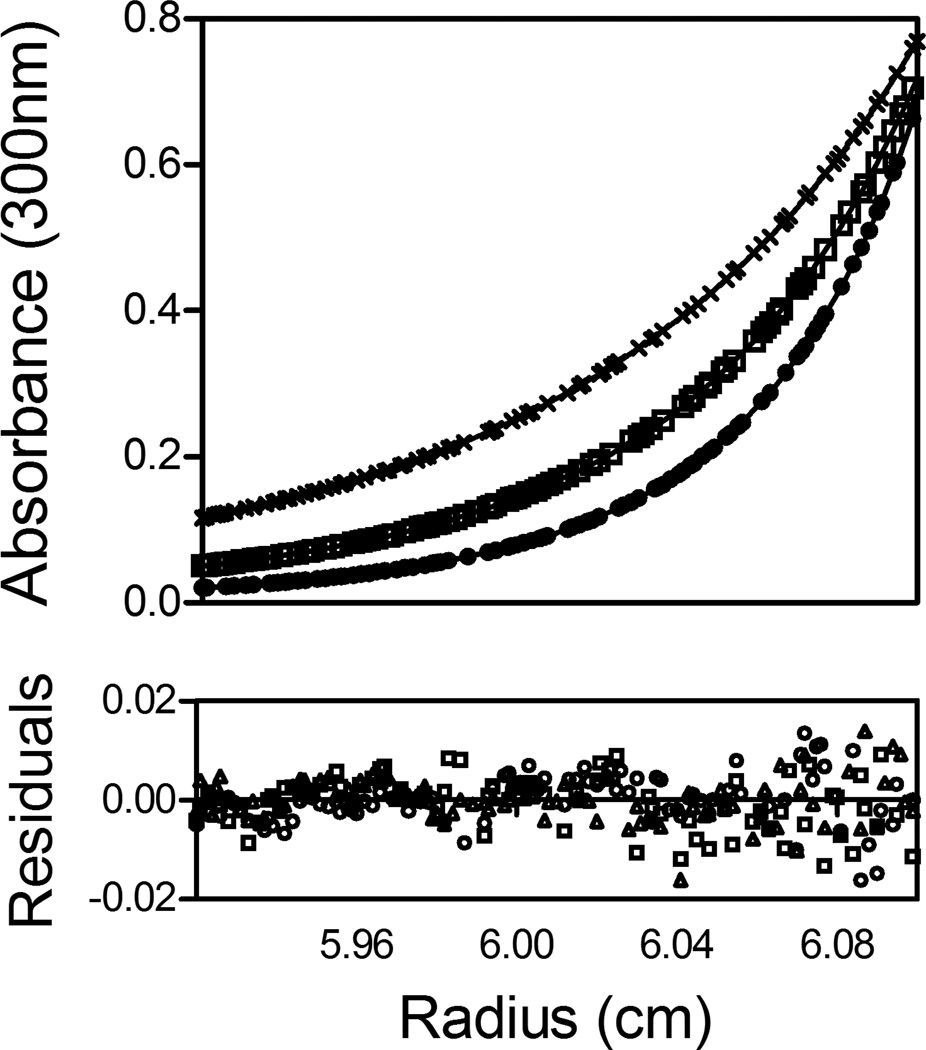
Fig. 3.
Absorbance versus radius profiles of E140A-bio-5`-AMP obtained at 40 µM protein concentration and centrifuged at 18 (×), 22 (□) and 26 (○) k rpm. The lines represent the best-fit curves obtained from global analysis of three data sets to a monomer-dimer model. The residuals of the fits are shown in the lower panel.

