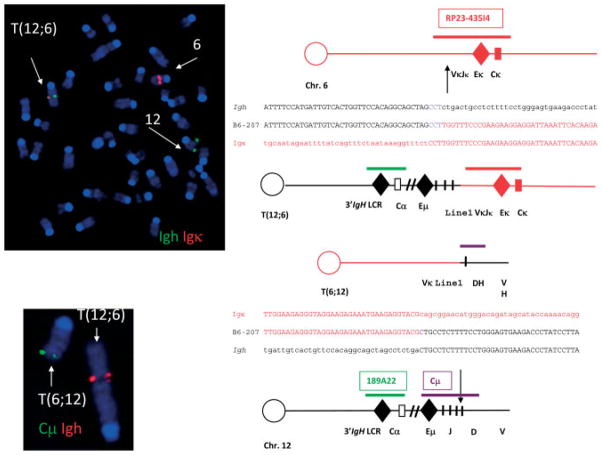
Figure 5.
Chromosomal studies of the B6-207 cell line. Top left: fluorescence in situ hybridization (FISH) using probes for Igh (green) and Igk (red) showing the translocation involving chromosome 12 and chromosome 6 (left side) that was present in all cells. Bottom left: FISH showing IgH (red) and Cμ (green) in abnormal locations. Diagrammatic structures of normal chromosome 12 and normal chromosome 6 with positions of probes for Igh, Cμ, and Igk and break-point positions give rise to the T(12;6) (right side).

