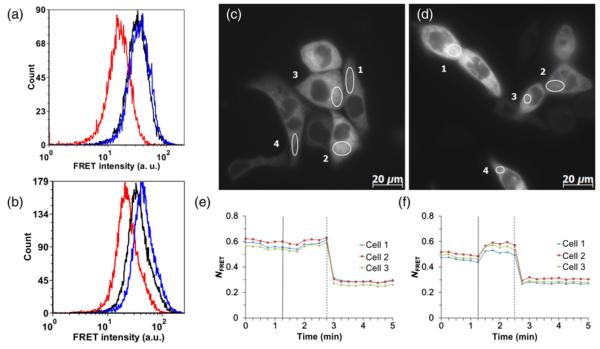
Figure 4.
Representative histograms of flow cytometric data for the CY-RL7 probe targeted to the ER of CHO cells non-treated (a) and pretreated (b) with 5 mmol/L NAC for 24 h. The black line corresponds to basal level and red and blue lines correspond to treatment with 1 mmol/L DTT or 2 mmol/L diamide, respectively. The ordinate (‘Count’) is the number of cells counted, and the abscissa (‘FRET intensity’) is the fluorescence intensity excited at 405 nm and collected through a 525 nm filter with a halfwidth of 25 nm. Time-lapse response of CY-RL7 targeted to the ER of HCT116 cells cultured without (c, e) and with (d, f) 5 mmol/L NAC to a sequential treatment with an exogenous oxidant and reductant. Each trace within panels (e) and (f) indicates a separate cell. Diamide (vertical solid line) and DTT (vertical dashed line) were added to cells at concentrations of 1 mmol/L. The data are representative of six independent experiments using a minimum of three ROIs. ER, endoplasmic reticulum; CHO, Chinese hamster ovary; NAC, N-acetylcysteine; DTT, dithiothreitol; FRET, Förster resonance energy transfer

