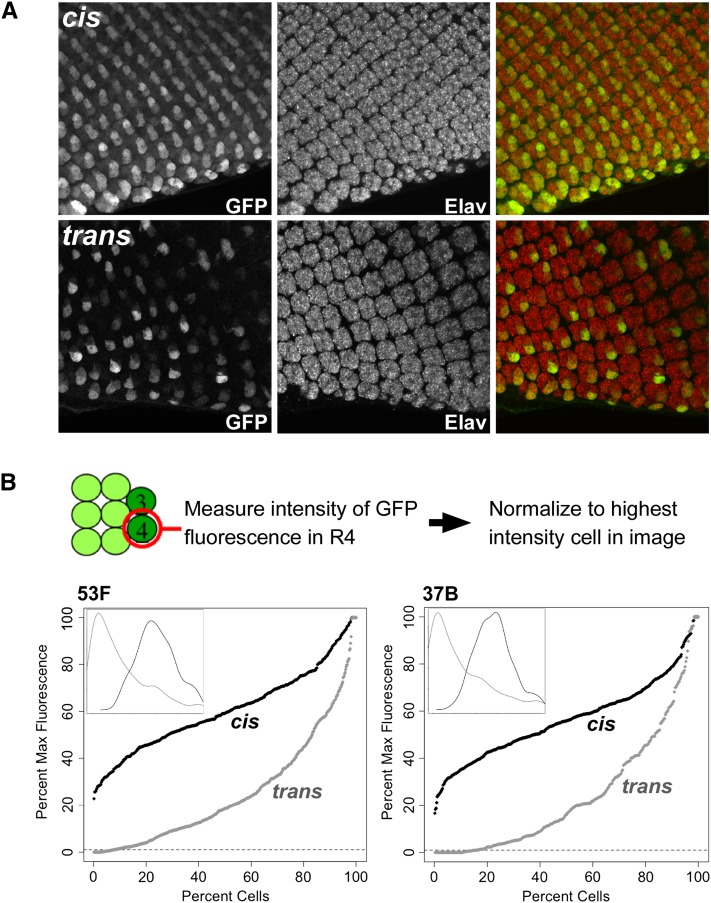
Figure 3 .
GMR action in trans is variegated. (A) Max-projected confocal z-stacks showing GMR-driven expression of GFP in cis (top) or in trans (bottom). Constructs are identical to those in Figure 2 and are integrated at 53F. GFP is visualized by immunostaining, and ommatidial clusters are shown by Elav immunostaining. GFP expression is highest in cells R3 and R4 in both genotypes, with trans-activation showing variegated expression. Posterior is oriented to the bottom of each image. (B) Quantification of relative fluorescent intensities. Top, rough schematic of cell positions in each ommatidial cluster; intensities of GFP fluorescence were measured for each R4 cell in the posterior-most five rows and normalized to the brightest cell of the image. Percentile plots show data for expression in cis (black) and in trans (gray) at 53F (n = 427 cells from four discs for cis and 532 cells from five discs for trans) and 37B (n = 467 cells from five discs for cis and 321 cells from four discs for trans). Dashed line represents a threshold of 1% of the maximum intensity, below which expression is not detectable. Insets show density plots of the same data, demonstrating the approximately normal distribution from expression in cis and strong leftward shift from expression in trans.

