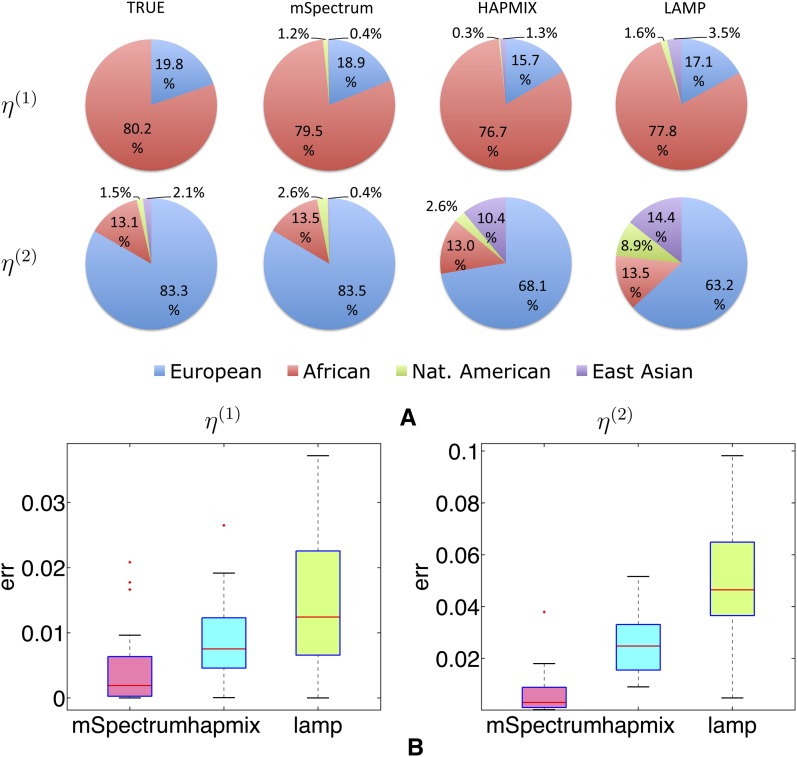
Figure 8 .
Performance under the four-way admixture assumption when the admixed population is generated with admixing proportions of η(1) = (0.2, 0.8, 0, 0) and η(2) = (0.8, 0.15, 0.03, 0.02) using Russian, BantuKenya, Pima, and Yi populations. We show two performance measures of (A) the true and the empirical η estimated as the average local ancestry proportions across individuals and markers and (B) the mean squared error rates of local ancestry estimation.

