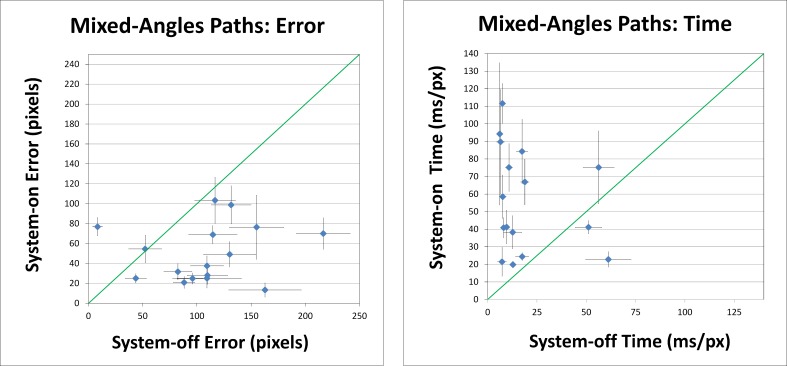
Figure 6. .
Left graph: normalized error scores from the mixed, single-angle tests. Right graph: normalized time to trace paths in the mixed, single-angle tests. Error areas and times were divided by path lengths (in pixels) to obtain the normalized scores shown here. Points indicate average performance for each subject. Error bars denote SEM. Diagonal lines represent the identity line. In general, system-on status reduced error and increased trace time.

