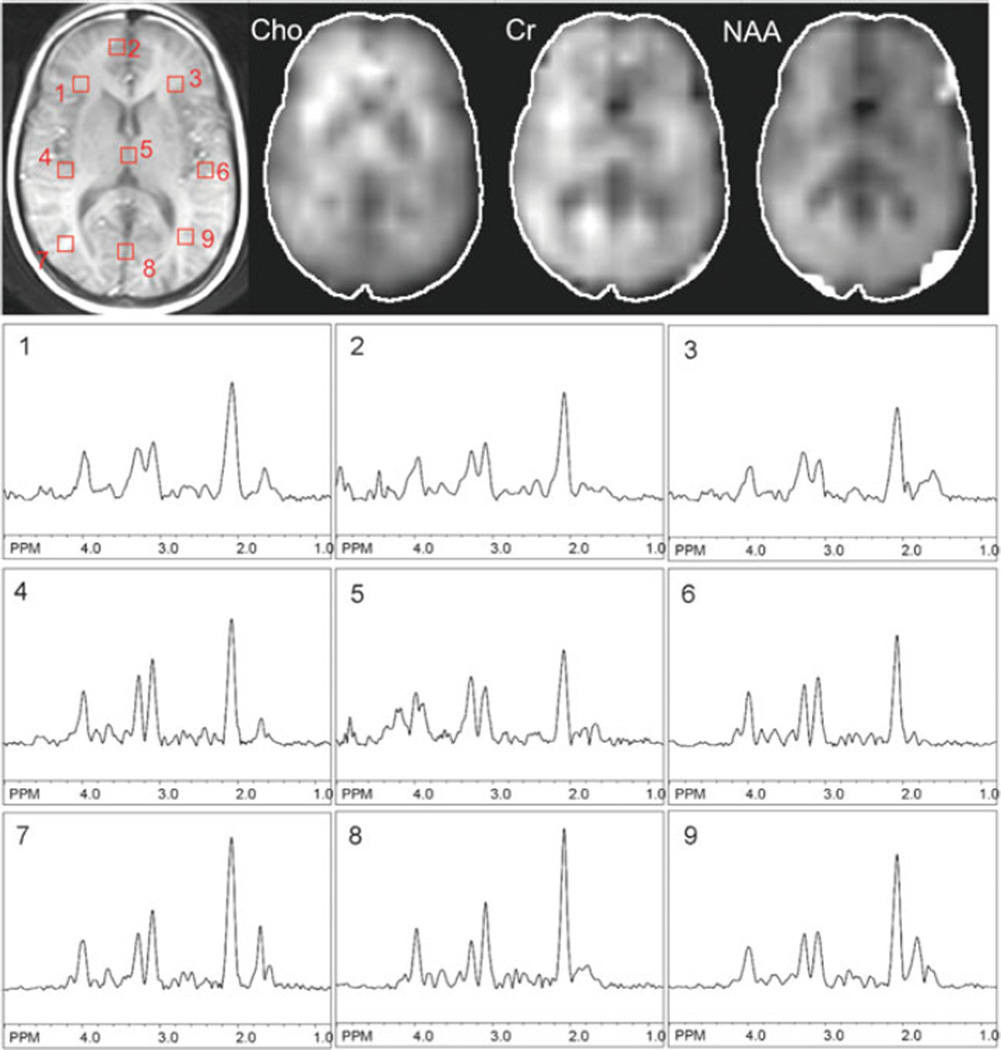
Fig. 9.6.
Example data from one slice (at the level of the lateral ventricles) of a multi-slice 2D-MRSI data from a normal human subject recorded at 3.0 T using the pulse sequence of Fig. 9.5. TR 2.5 s, TE 140 ms, nominal voxel size 0.65 cm3. In addition to the T1-weighted MRI scan, spectroscopic images of choline, creatine, and N-acetylaspartate and selected spectra from the left and right hemispheres are shown.

