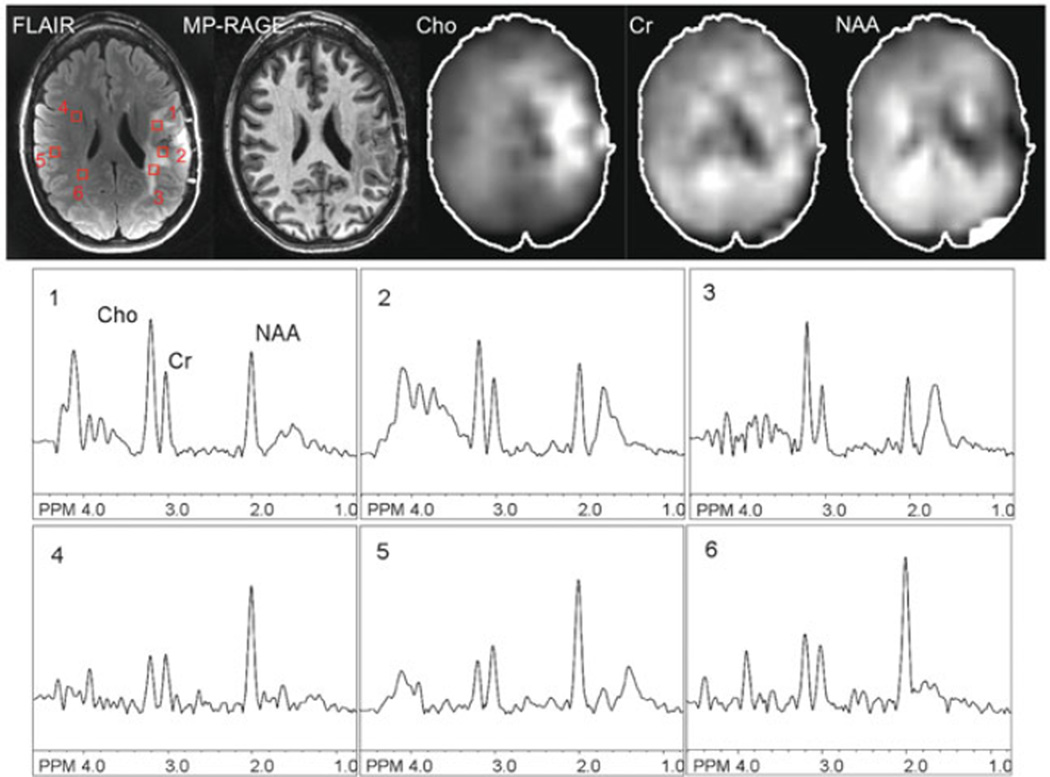
Fig. 9.8.
An example of 2D-SENSE-MRSI in a patient with a high-grade left frontal glioma recorded post-treatment at 3.0 T. TR 2.5 s, TE 140 ms, nominal voxel size 0.65 cm3, SENSE acceleration factor = 6, scan time 5:05 min. FLAIR and non-contrast T1-weighted (“MP-RAGE”) MR images, spectroscopic images (choline, creatine, NAA), and selected spectra are shown. The core of the lesion is characterized by reduced levels of NAA and other metabolites, consistent with necrotic tissue, while the T2 hyperintense perilesional areas demonstrate elevated Cho compared to the contralateral hemisphere, consistent with residual or recurrent tumor.

