
Fig. 5. Dye separation studies.
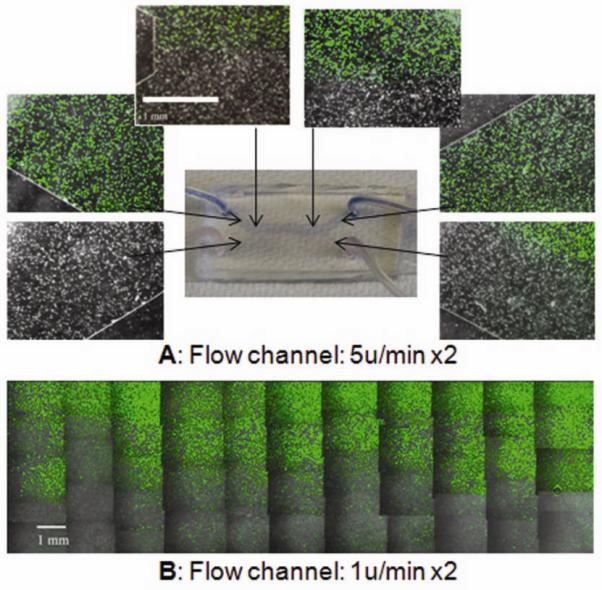
Separation of Calcein stain in the flow channel at the flow rates of 5μl/min × 2 (A) and 1μl/min x2 (B). Data are for the diffusion coefficient of Calcein DCalcein =2.6*10−6 cm2/s, and inlet concentrations of Calcein C+= 2μM and C−=0, diffusion coefficient of Trypan blue of DTrypan blue= 2.21* 10−6 cm2 /s, and input concentrations of Trypan blue of C+=229 μM and C−=0. Flow direction is left to right. Original magnification: 100X. Scale bar: 1mm.