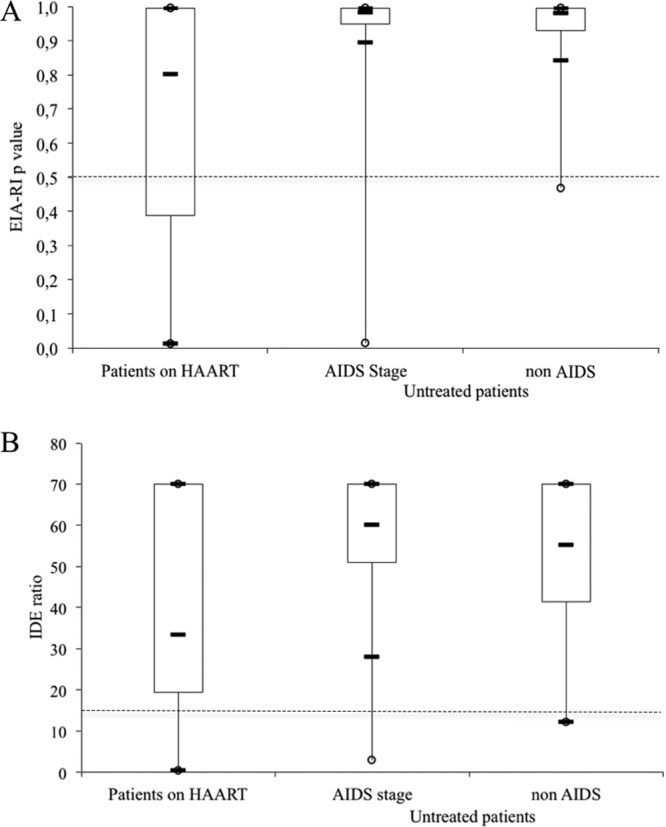
Fig 1.

Distribution of the EIA-RI values determined with the IDE-V3 formula (A) or IDE ratio (B). Horizontal black bars denote the 10th, 50th (median), and 90th percentiles. Boxes represent the 25th to 75th percentiles. The threshold is shown by the dotted line.
