Fig 2.

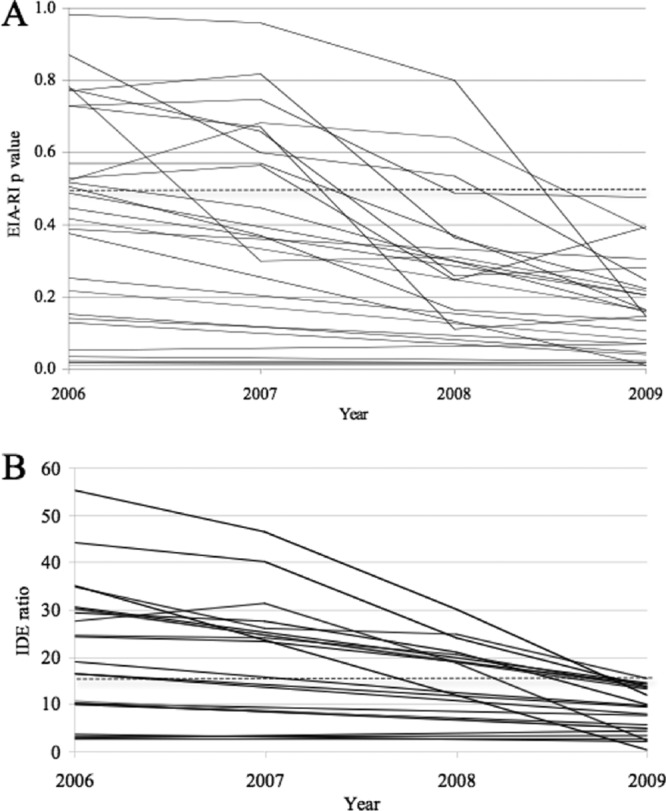
Kinetics of EIA-RI values over a 3-year period among patients classified as “false recent” at the last sample, determined using the IDE-V3 formula (A) or the IDE ratio (B). The threshold is shown by the dotted line.

Kinetics of EIA-RI values over a 3-year period among patients classified as “false recent” at the last sample, determined using the IDE-V3 formula (A) or the IDE ratio (B). The threshold is shown by the dotted line.