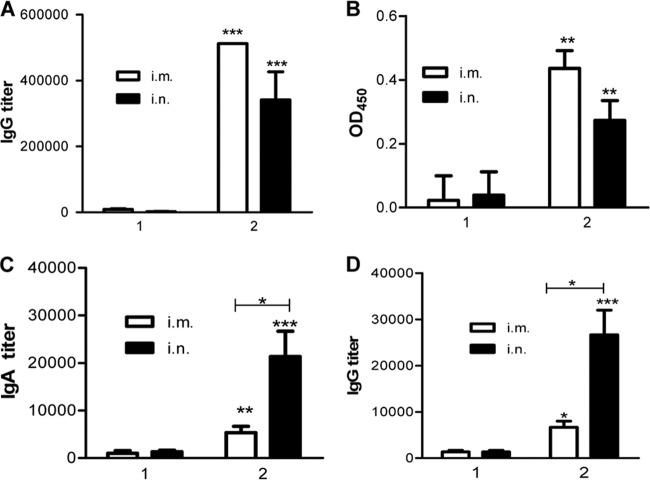
Fig 3.
Antibody responses. (A) Serum IgG recognizing M2e in immunized mice. To determine serum M2e-specific IgG titers, ELISA plates were coated with 100 μl/well of synthesized M2e peptide (5 μg/ml; at the Emory University Biochemical Core Facility). (B) Endpoint titers of IgG recognizing native M2 protein. MDCK cells were infected with A/PR8 viruses at an MOI of 1. Uninfected cells were used as a control. At 12 h postinfection, cells were washed with PBS and fixed with 0.5% glutaraldehyde. Samples diluted 80-fold were applied to detect antibody binding, as described in Materials and Methods. Data depict the OD450 (mean ± SD) with infected cells, with the background of uninfected cells subtracted. Groups 1 and 2 represent mouse groups immunized with 4.M2e and 4.M2e-tFliC/M1 VLPs, respectively. (C) Lung lavage IgA. IgA endpoint titers were determined as described for the serum IgG endpoint titer in panel A, but the secondary antibody used was HRP-conjugated goat anti-mouse IgA antibody. (D) Lung lavage IgG. Representative data are the geometric mean (GM) ± 95% confidence interval (CI) of six mice in each group at 4 weeks after the last immunization. Asterisks on the top of a bar present the statistical difference of the group to its counterpart in the M2e group. The statistical difference between other groups is labeled with a connecting line. *, P < 0.05; **, P < 0.01; ***, P < 0.001.

