Fig 4.
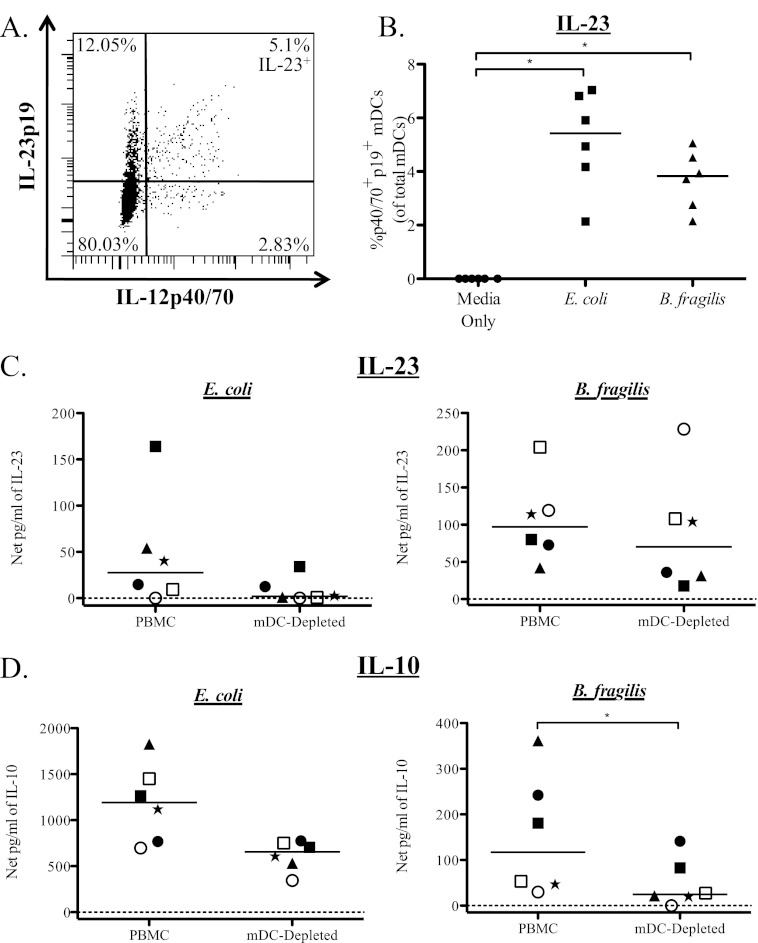
mDC produce IL-10 and IL-23 in response to E. coli and B. fragilis stimulation. Total PBMC were stimulated with bacteria, and mDC were evaluated for expression of IL-12p40/70 and IL-23p19. (A) Example flow plot demonstrating production of IL-12p40/70 and IL-23p19 by mDC in response to B. fragilis stimulation. (B) Percentage of mDC expressing IL-12p40/70 and IL-23p19 (IL-12p40/70+ IL-23p19+) after stimulation with E. coli and B. fragilis (n = 6). Results are shown as the net percentage of IL-12p40/70+ IL-23p19+ mDC, with background (isotype staining) subtracted from the antibody value. To evaluate the contribution of mDC to total cytokine production, mDC were depleted from total PBMC, and levels of IL-23 (C) and IL-10 (D) in response to E. coli and B. fragilis were evaluated in culture supernatants. Results are shown as the net amount of the indicated cytokine (stimulation condition minus the medium-only value). In order to demonstrate the response of individual donors under each condition, different symbols are used to identify each donor. Horizontal bars indicate median values. Statistical significance between each condition was evaluated using a Wilcoxon matched-pairs signed rank test. *, P < 0.05.

