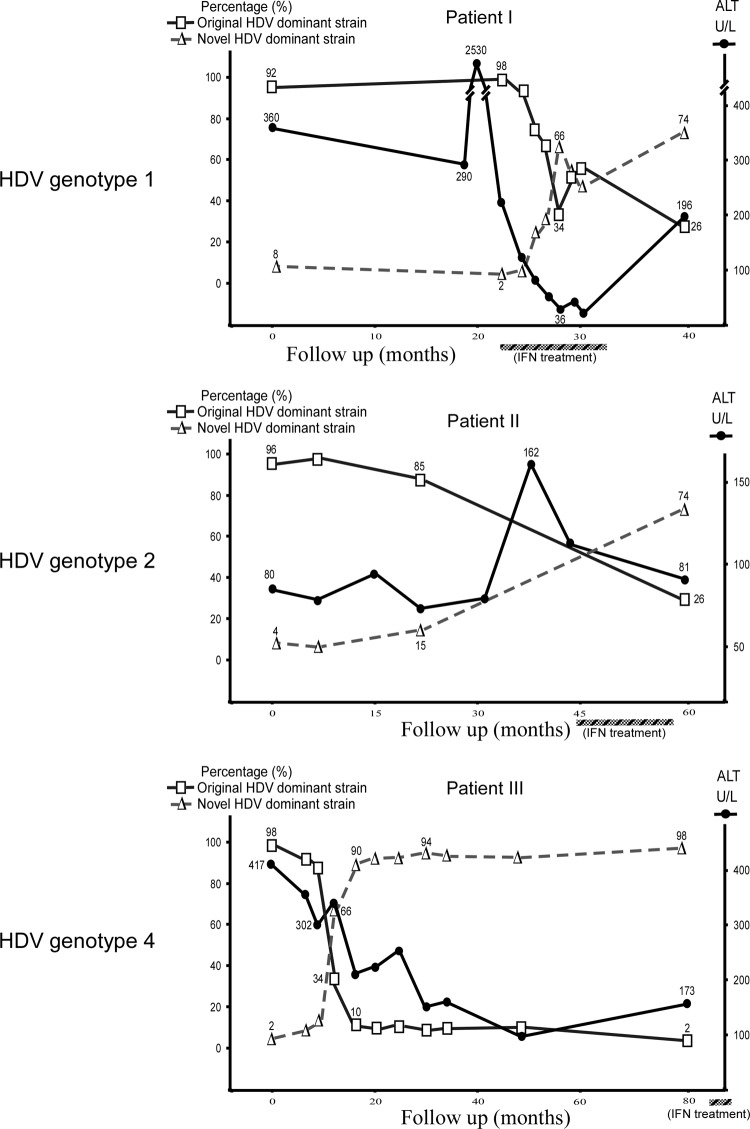
Fig 1.
Replacement of the original dominant species by novel dominant species during the disease courses of three patients chronically infected with different genotypes of HDV. At least 100 HDV colonies were randomly selected by large-scale screening carried out using quasispecies-specific RFLP analysis at each time point for each case. The original dominant HDV strain and the novel dominant strain are indicated by the symbols □ and △, respectively. The values on each curve are relative percentages of the original and novel dominant HDV species. The percentages of the novel dominant species gradually increased as the percentages of the original dominant species decreased after ALT elevations (U/L, units per liter). The periods of IFN-α treatment are marked by the hatched bars below the graphs.

