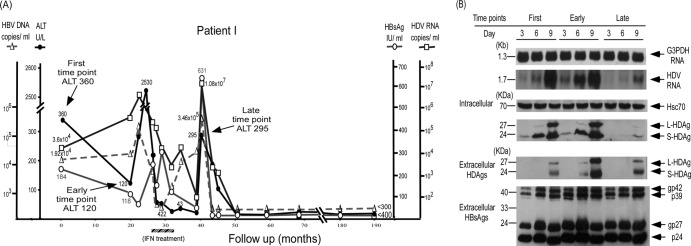
Fig 3.
Correlation of clinical courses with HDV replication and HDAg expression of novel dominant HDV species after elevation of ALT levels in patient I, who went into disease remission. (A) The clinical course of patient I is shown. Arrows mark the time points of blood sampling to detect the dominant HDV species at the first, early, and late time points of the disease course. The period of IFN-α treatment is marked by the hatched bar below the graph. (B) Comparison of intracellular HDV RNA replication, HDAg expression, and secreted HDV virions in culture medium among the dominant HDV species isolated from patient I at different time points on days 3, 6, and 9 posttransfection with an HBV expression plasmid. The equal loading of RNA and protein samples was assessed by hybridization with a DIG-labeled DNA probe for G3PDH and a monoclonal antibody specific for heat shock protein Hsc70, respectively.

