
Fig 3.
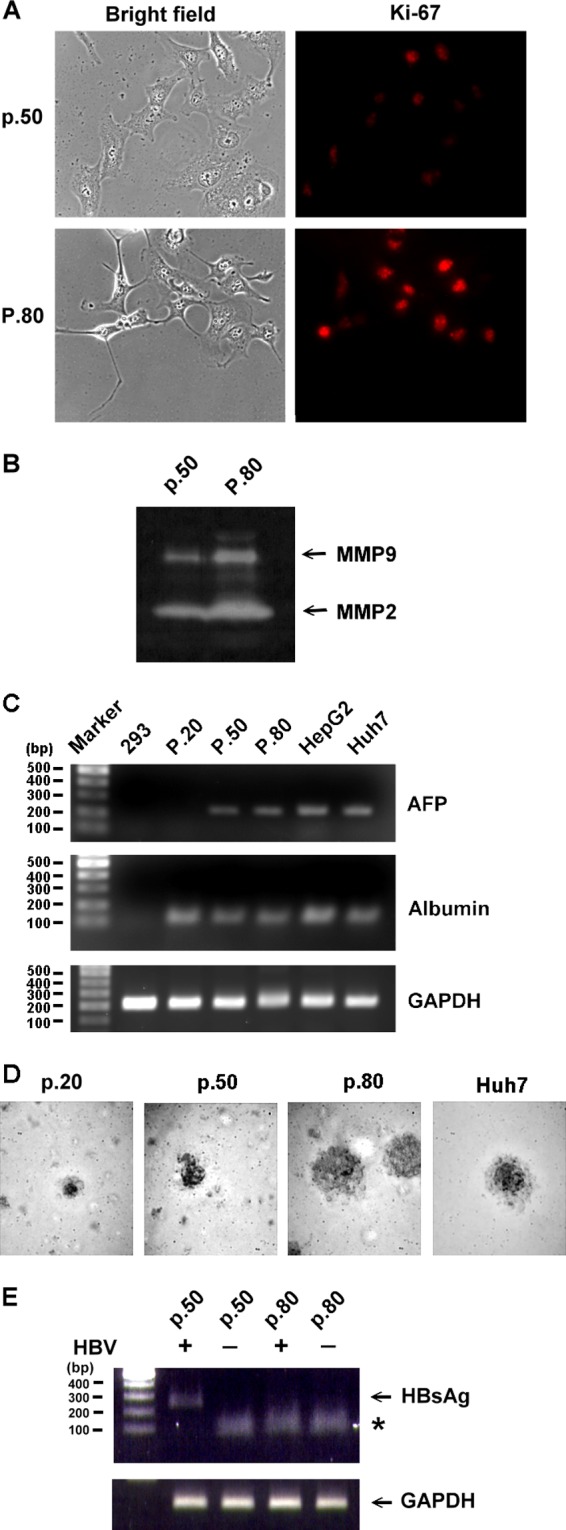
Characterization of HuS-E/2 cells at different passages and their susceptibility to HBV. (A) Immunofluorescence staining for Ki-67. HuS-E/2 cells at passage 50 (p.50) and passage 80 (P.80) were subjected to immunofluorescence staining with rabbit anti-Ki-67 antibodies and Cy3-conjugated goat anti-rabbit IgG antibodies (red) and visualized under a fluorescence microscope (right). Phase-contrast images are shown on the left. (B) Increase in MMP-2 and MMP-9 gelatinolytic activity in HuS-E/2 cells with increased numbers of passages. The zymographic assay was performed after the indicated number of passages. (C) Levels of mRNAs coding for AFP and albumin in 293 cells, HuS-E/2 cells at passages 20, 50, and 80, HepG2 cells, and Huh7 cells. RNA was isolated from cells and analyzed by RT-PCR. Control RT-PCRs were performed for endogenous GAPDH. DNA markers are shown as molecular masses in 100-bp increments. (D) Colony formation in soft agar of HuS-E/2 cells at passage 20, 50, or 80 and of Huh7 cells. Cells were incubated in 0.35% agarose containing 10% FCS on top of 0.7% agarose containing 10% FCS at 37°C for 14 days, and then colonies were photographed under a light microscope. (E) HuS-E/2 cells at passage 50 or 80 were cultured for 12 days with 2% DMSO and incubated with or without HBV for 20 h, and then nonbound HBV was removed and the cells were incubated for an additional 12 days, when RNA was isolated and subjected to reverse transcription and PCR analysis to detect the presence of HBV HBsAg mRNA. Control PCRs were performed for endogenous GAPDH. DNA markers are shown as molecular masses in 100-bp increments.