Fig 1.
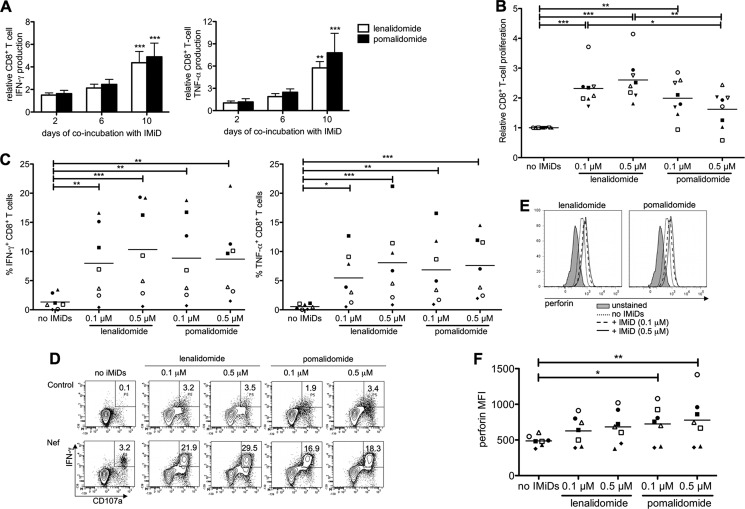
IMiDs enhance the magnitude of HIV-specific CD8+ T-cell responses. Purified CD8+ T cells were stimulated with DCs electroporated with mRNA encoding Gag or Nef. (A) T cells were stimulated in the presence of IMiDs (0.5 μM) for 2, 6, or 10 days before the IMiDs were removed by washing the cells. On day 10, the CD8+ T cells were cocultured overnight with DCs and cytokine secretion was determined by intracellular staining. The bar graphs show the percentages of IFN-γ+ (left) or TNF-α+ (right) CD8+ T cells relative to the no-IMiD condition (means from 5 experiments). The error bars show the standard errors of the means (SEM). T-cell responses that differed significantly from those under the no-IMiD condition are indicated. (B) T cells were stimulated in the presence of IMiDs (0.1 to 0.5 μM) for 6 days, after which CD8+ T-cell proliferation was measured by CFSE dilution assays. CD8+ T-cell proliferation, relative to that under the no-IMiD condition, is depicted. (C to F) After 10 days of stimulation, CD8+ T cells were cocultured overnight with DCs electroporated with Gag or Nef, after which antigen-specific T-cell responses were analyzed. (C) The overview graphs show the percentages of IFN-γ (left)- and TNF-α (right)-producing CD8+ T cells. (D) Flow cytometry plots showing the coexpression of IFN-γ and CD107a on HIV-specific CD8+ T cells. One representative out of 7 experiments is shown. (E) Histogram overlays showing the perforin expression in CD107a+ CD8+ T cells. One representative out of 7 experiments is shown. (F) Overview graphs showing the perforin MFI in CD107a+ CD8+ T cells. On the overview graphs shown in panels B, C, and F, each symbol represents one experiment. Equal shapes indicate that the Gag-specific (filled symbols) or the Nef-specific (open symbols) CD8+ T-cell responses of the same patient were analyzed. Horizontal lines indicate the means from all experiments. *, P < 0.05; **, P < 0.01; ***, P < 0.001.

