
Fig 6.
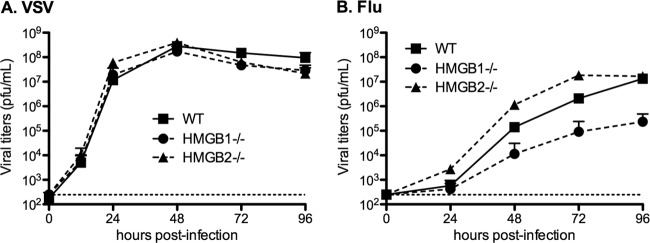
Viral growth curves on wild-type, HMGB1−/−, or HMGB2−/− MEFs. MEF-WT, MEF-HMGB1−/−, and MEF-HMGB2−/− cell monolayers were infected with the VSV (Indiana) (A) or the WSN influenza virus (B) at an MOI of 10−4 or 10−3 PFU/cell, respectively. At the indicated time points, the supernatants were harvested, and infectious virus titers were determined by plaque assays on BSR (A) or MDCK cells (B). The horizontal dotted lines represent the limit of detection of the plaque assays. The data are expressed as means ± the SD (n = 3).