
Fig 7.
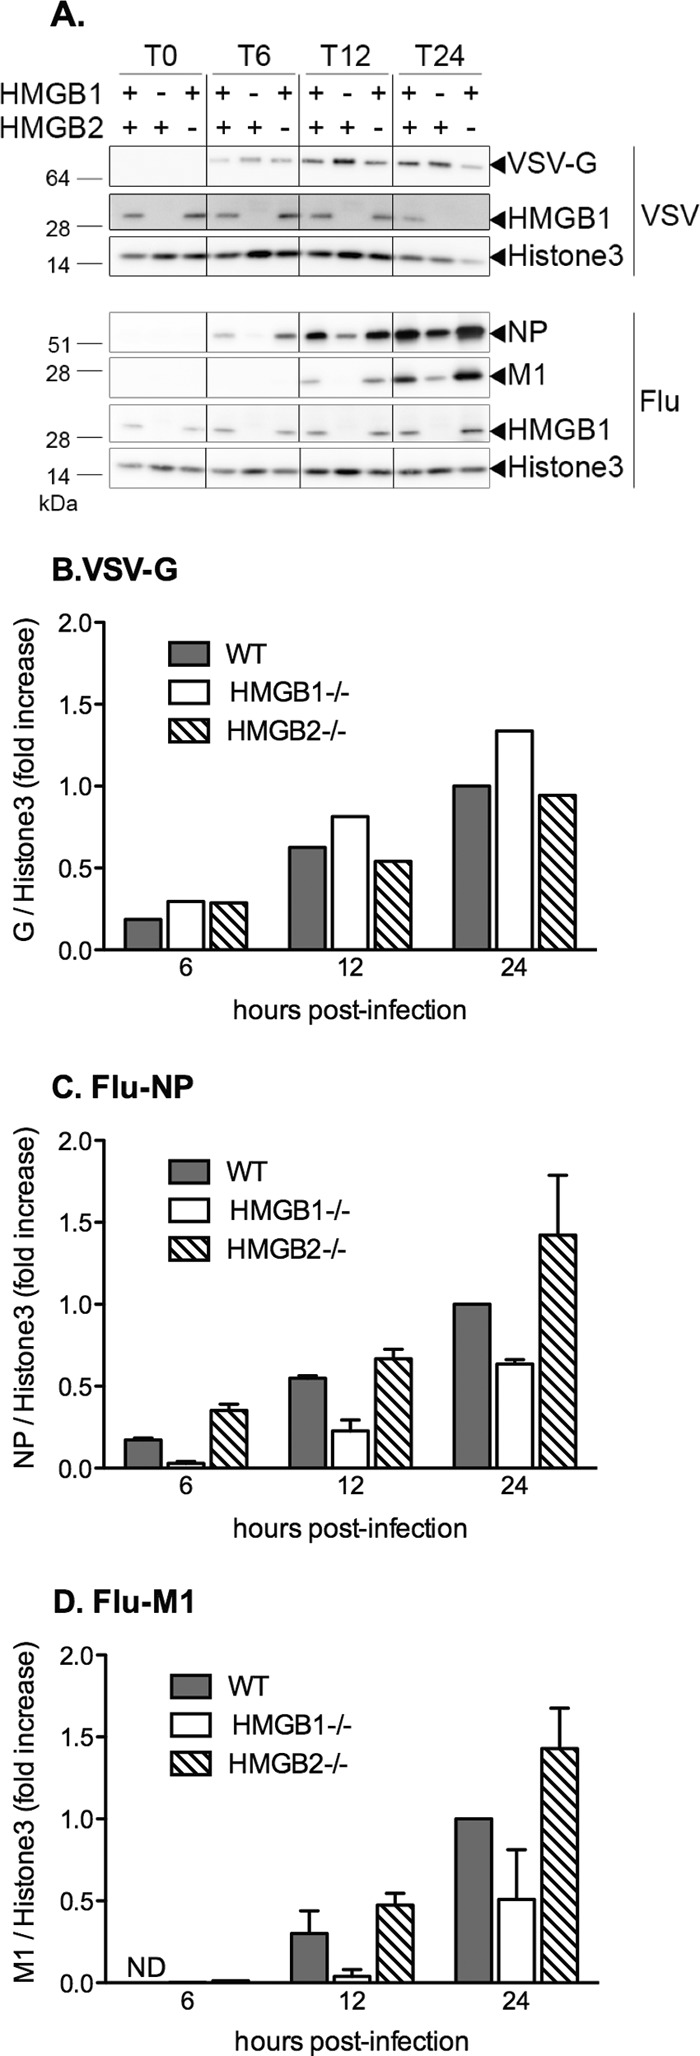
Steady-state levels of viral proteins after infection of wild-type versus HMGB1−/− or HMGB2−/− MEFs. (A) MEF-WT, MEF-HMGB1−/−, and MEF-HMGB2−/− cell monolayers were infected with VSV (upper panel) or WSN virus (lower panel) at an MOI of 5 PFU/cell. Whole-cell lysates were prepared at the indicated time points and analyzed by Western blotting as described in Materials and Methods, using antibodies recognizing the VSV-G glycoprotein (upper panel), the influenza virus NP and M1 proteins (lower panel), and the HMGB1 or the histone 3 proteins (upper and lower panels). One representative experiment of two with similar results is shown. (B to D) Graphic representation of the Western blot quantification. After the membranes were scanned with a G-Box (SynGene), the VSV-G, NP, M1, and histone 3 signals were quantified using GeneTools software (SynGene). The VSV-G (B), NP (C), and M1 (D) signals were normalized with respect to the histone 3 signal. The data are expressed as ratios and as means ± the SD of one (B) or two (C and D) independent experiments. ND, not detected.