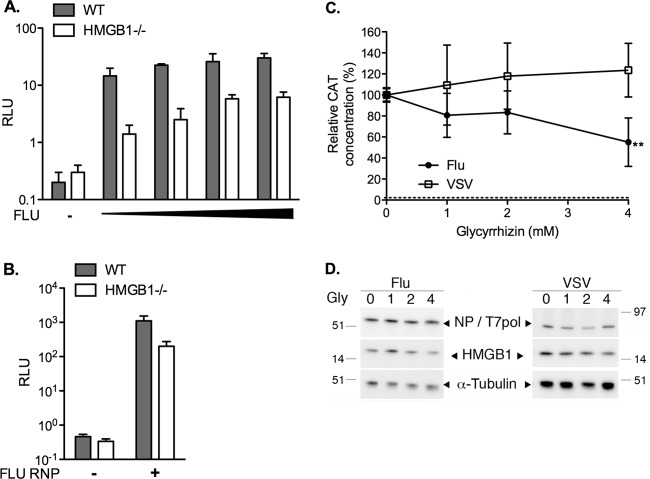
Fig 8.
Effect of HMGB1 depletion or inhibition on the transcription/replication of an influenza virus-like minigenome. (A) Transcription/replication of an influenza virus-like minigenome in infected wild-type or HMGB1−/− MEFs. A plasmid allowing the expression of an influenza virus-like Renilla luciferase reporter RNA was cotransfected with a firefly luciferase expression plasmid in MEF-WT cells (gray bars) or in MEF-HMGB1−/− cells (white bars). At 24 h posttransfection, the cells were either mock infected (−) or infected with WSN virus at increasing MOIs (5 to 200 PFU/cell, black triangle). The Renilla luciferase activities measured in cell extracts at 24 hpi were normalized with respect to the firefly luciferase activities (RLU, relative light units). They are expressed as means ± the SD of triplicates and are representative of two independent experiments. (B) Transcription/replication of an influenza virus-like minigenome upon transient reconstitution of ribonucleoproteins in wild-type or HMGB1−/− MEFs. A plasmid allowing the expression of an influenza virus-like Renilla luciferase reporter influenza virus RNA was cotransfected with a firefly luciferase expression plasmid only (−) or together with PA, PB1, PB2, and NP expression plasmids (+) in MEF-WT cells (gray bars) or in MEF-HMGB1−/− cells (white bars). The Renilla luciferase activities measured in cell extracts at 24 h posttransfection were normalized with respect to the firefly luciferase activities (RLU, relative light units) and are expressed as means ± the SD of quadruplicates. (C and D) Transcription/replication of an influenza virus-like or a VSV-like minigenome in glycyrrhizin-treated 293T cells. 293T cells were cotransfected with plasmids, allowing the expression of a pseudoviral CAT reporter virus-specific RNA and the viral ribonucleoprotein components of VSV (opened squares) or WSN influenza virus (closed circles). At 8 h posttransfection, the culture medium was replaced with fresh medium supplemented with 1, 2, or 4 mM glycyrrhizin. (C) Cell extracts were prepared at 48 hpi and tested for CAT expression by ELISA. CAT levels were normalized with respect to the total protein concentration. The results are expressed as percentages and as means ± the SD of three independent experiments performed in triplicates (**, P = 0.0316, unpaired two-tailed Student t test [n = 3]). The horizontal dotted line represents the background signal. (D) Cell extracts were tested by Western blotting with antibodies against the NP, T7 polymerase (T7pol), HMGB1, and α-tubulin proteins. The results of one representative experiment from two with similar results are shown.

