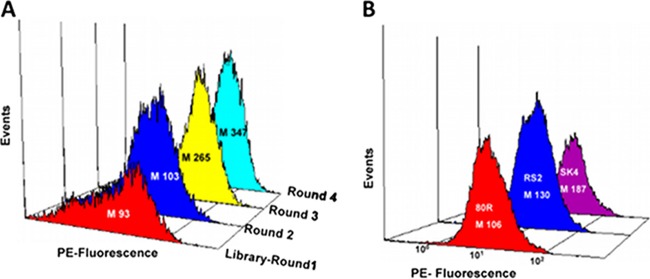
Fig 1.
Comparison of fluorescence histograms. E. coli spheroplasts were labeled with 20 nM RBD, and binding was detected with 200 nM anti-FLAG PE. (A) Mean fluorescence intensity (M) of E. coli spheroplast clones recovered after three successive rounds of sorting compared to a library of random mutants of the 80R scFv. (B) Mean fluorescence intensity (M) of E. coli cells expressing the RS2 and SK4 scFvs compared to 80R scFv.

