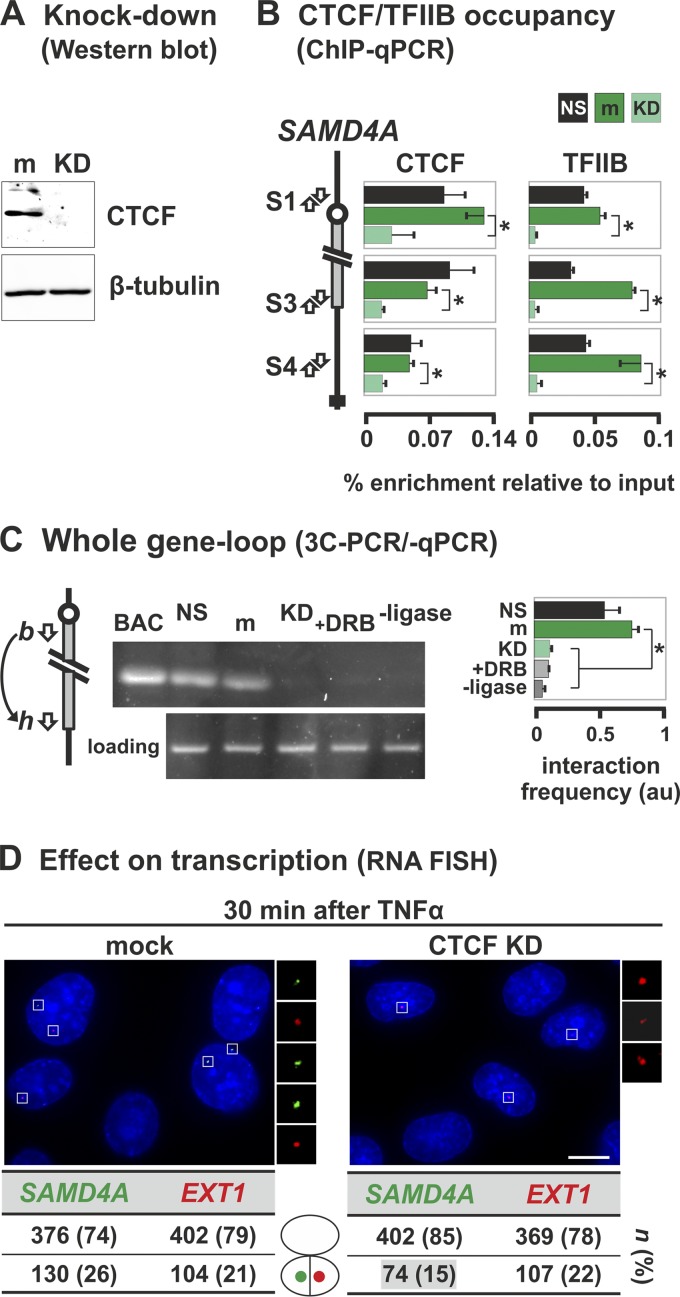
Fig 8.
TFIIB and CTCF stabilize the whole-gene loop in SAMD4A. HUVECs were treated with siRNAs to knock down CTCF (KD) or mock treated (m), grown (48 h), starved (18 h) in low-serum medium (nonstarved cells [NS] serve as a control), and harvested without TNF-α stimulation (except in panel D). (A) Western blot showing the siRNAs efficiently knock down CTCF without affecting β-tubulin. (B) ChIP-qPCR using antibodies targeting CTCF or TFIIB (percent enrichments ± the SD; n = 6) confirms that little CTCF in knocked-down cells is bound to three cognate sites in SAMD4A (S1, S3, and S4). CTCF knockdown leads to a concomitant loss of TFIIB binding. Serum starvation does not alter either binding profile. *, enrichment significantly different (P < 0.01; unpaired two-tailed Student t test). (C) 3C-PCR (using primers indicated in the diagram on the left) shows that the band indicative of the whole-gene loop disappears after knocking down CTCF or after DRB treatment (50 μM added 25 min before harvesting). BAC and loading controls are as described in Fig. 3B. –Ligase, control in which ligase was omitted from 3C reaction. The box (right) gives the 3C-PCR interaction frequencies (arbitrary units [au] ± the SD; n = 4) normalized relative to values given by loading and intra-GAPDH controls. *, significant difference (P < 0.01; two-tailed unpaired Student t test; n = 4). (D) CTCF knockdown reduces SAMD4A transcription induced by TNF-α (assessed using RNA FISH with intronic probes). Typical images collected 30 min after induction are shown (insets illustrate foci). Knocking down CTCF significantly reduces the number of SAMD4A (green) but not EXT1 foci (red) compared to the mock-treated control (P < 0.01; two-tailed the Fisher exact test). n, number of foci (percentages in brackets). Bar, 5 μm.

