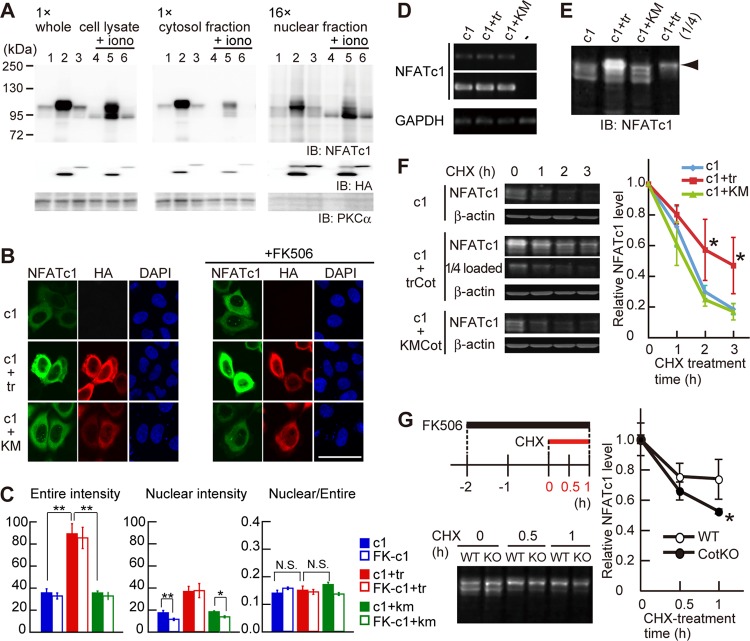
Fig 4.
Cot increases NFATc1 expression level through protein stabilization. (A) Subcellular fractionation of NFATc1 in HeLa cells overexpressing NFATc1 alone (lanes 1 and 4), NFATc1 and trCot (lanes 2 and 5), or NFATc1 and KMCot (lanes 3 and 6). HeLa cells were treated without (lanes 1 to 3) or with (lanes 4 to 6) 2.5 μM ionomycin (iono) for 10 min. Note that the amount loaded of the nuclear fraction is 16-fold that of the cytosol fraction. (B) NFATc1 localization in HeLa cells coexpressing trCot or KMCot in the absence (left) or presence (right) of FK506. Bar, 50 μm. (C) NFATc1 signal intensity in the entire cell (left) and in the nucleus (middle) and the ratio between the nucleus and the entire cell (right). Shown are means ± standard errors of the means derived from analysis of 32 to 37 cells. *, P < 0.05; **, P < 0.01. N.S., difference was not significant. (D) NFATc1 and GAPDH mRNA levels in HeLa cells, as detected by RT-PCR. (E) Increased expression levels and hyperphosphorylation of NFATc1 (arrowhead) in HeLa cells cotransfected with trCot, detected with the Odyssey system. These samples were used for the degradation assay whose results are shown in panel F. (F) NFATc1 protein degradation dynamics in HeLa cells treated with cycloheximide (CHX). (Left) NFATc1 levels in cells after CHX treatment. β-Actin was used for protein normalization. (Right) Relative amounts of NFATc1 protein. NFATc1 coexpressed with trCot showed a decreased degradation rate compared to protein coexpressed with KMCot or alone. n = 4 for each group. Values are means ± SD. *, P < 0.05. (G) NFATc1 protein degradation dynamics in primary WT and CotKO osteoclasts cocultured with ST2 cells and treated with CHX. The experimental procedure is depicted in the left upper panel. Note that the CHX chase assay was performed in the presence of FK506. (Bottom left) NFATc1 protein levels in osteoclasts after CHX treatment. (Right) Relative amounts of NFATc1. NFATc1 in CotKO osteoclasts showed a decreased degradation rate compared to protein in WT osteoclasts. n = 3 for each group. Values are means ± SD. *, P < 0.05.

