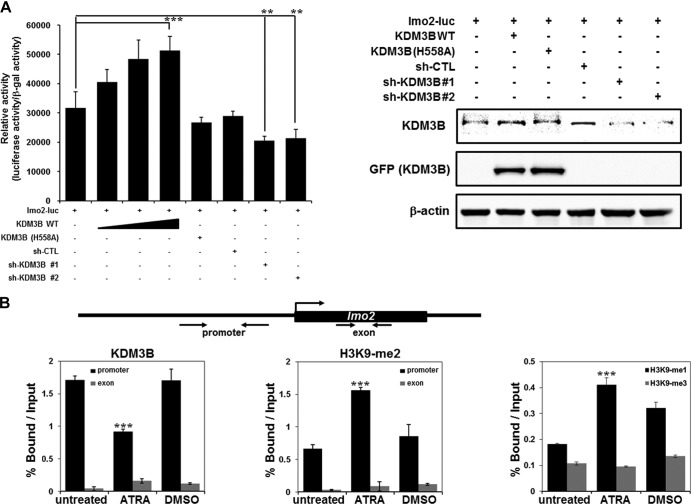
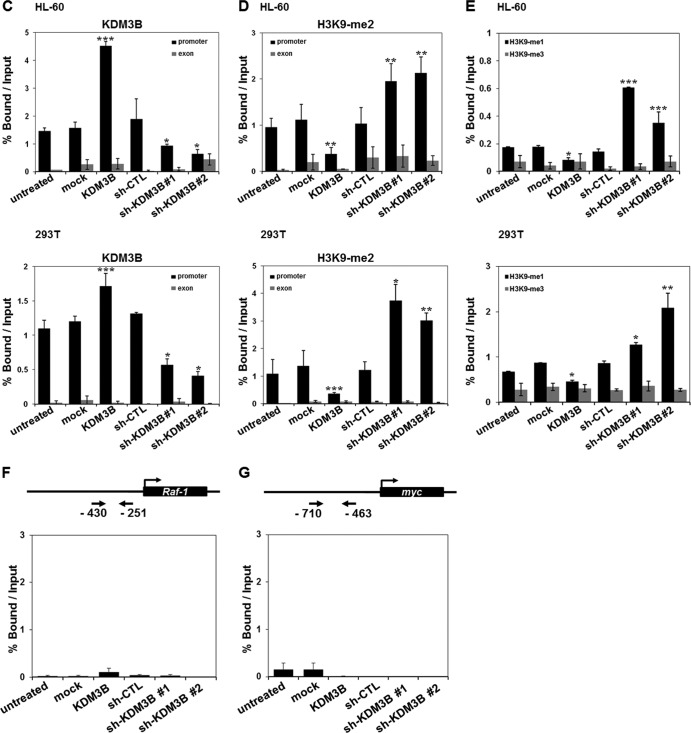
Fig 4.
Recruitment of KDM3B to the lmo2 promoter. (A) 293T cells were transfected with the pGL-lmo2 promoter reporter and the indicated DNA constructs and sh-RNAs, and their cell extracts were assayed for luciferase activity. Luciferase activities were normalized to that of β-galactosidase. Each P value is the mean of five replicates from a single assay (left panel). The results are representative of at least three independent experiments (± SD). **, P < 0.01; ***, P < 0.001. Immunoblot analyses of the expression levels of endogenous and exogenous KDM3B in sh-KDM3B construct 1- or construct 2-transfected 293T cells were shown using anti-KDM3B and anti-GFP (right panel). (B) Schematic diagram of primer pairs in ChIP analysis (upper panel). Arrows indicate the primers used for real-time PCR amplification. ChIP analyses of the lmo2 promoter in ATRA-treated HL-60 cells were conducted using anti-KDM3B (left panel), anti-H3K9-me2 (middle panel), and H3K9-me1/3 (right panel) and examined via real-time PCR. Results are the means ± SDs; n = 3. ***, P < 0.001. (C to E) HL-60 (upper panel) or 293T (lower panel) cells were transfected with KDM3B and sh-KDM3Bs, and the ChIP assay and real-time PCR were performed using anti-KDM3B antibodies (C) to determine the methylation status of H3K9-me2 (D) and H3K9-me1/3 (E) in the lmo2 promoter or exonic region. Results are the means ± SDs; n = 3. *, P < 0.05; **, P < 0.01; ***, P < 0.001. (F and G) Schematic diagram of primer pairs in ChIP analysis (upper panel). Arrows indicate the primers for real-time PCR amplification. Transfected HL-60 cells with KDM3B and sh-KDM3Bs were analyzed by ChIP using anti-KDM3B antibodies. The immunoprecipitated DNA was amplified by PCR using the promoters of Raf-1 (F) and Myc (G). The results are representative of at least three independent experiments (± SD). *, P < 0.05; **, P < 0.01; ***, P < 0.001.


