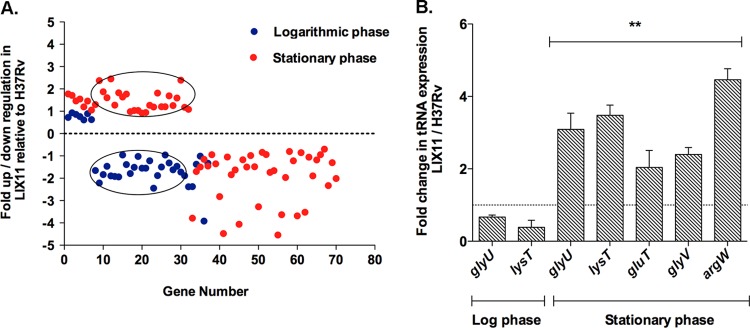
Fig 1.
Graphical representation of the trend in tRNA expression in the ΔpknK mutant during logarithmic and stationary-phase growth. Differences between the transcriptional profiles of an M. tuberculosis ΔpknK strain (LIX11) and the wild-type H37Rv were determined as a function of growth using microarrays. (A) Scatter plot showing the distribution of genes (up- or downregulated) in the LIX11 mutant relative to the wild-type during logarithmic-phase (blue dots) and stationary-phase (red dots) growth based on their respective changes listed in Data sets S1 and S2 in the supplemental material. Note that each spot indicates a unique gene that is differentially expressed in the LIX11 mutant during log and stationary phases. The circled points highlight the biphasic expression of the tRNA genes in the mutant. A large subset of tRNA genes was downregulated in the mutant during logarithmic phase but upregulated during stationary phase. (B) qRT-PCR analyses of 5 randomly selected tRNA genes, glyU, lysT, gluT, glyV, and argW, in LIX11 and H37Rv during log and stationary phases. Expression was normalized using sigA mRNA as an internal control. The change in tRNA expression in the LIX11 mutant relative to H37Rv grown under specific growth conditions is presented as the mean and standard deviation (SD) of data from two independent experiments. The baseline expression of tRNA genes in H37Rv was set to 1.0 (dashed line). **, P < 0.01.

