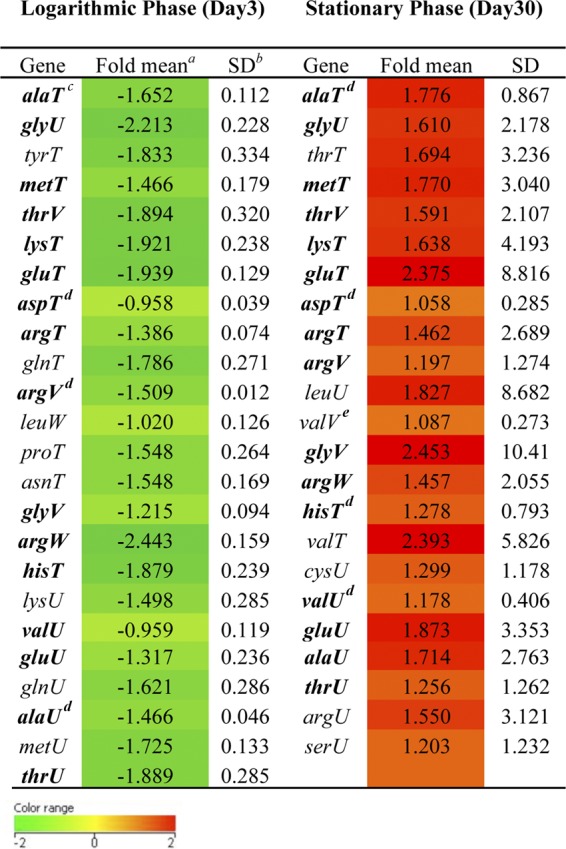
Table 2.
Differential expression of tRNA genes in M. tuberculosis ΔpknK mutant (LIX11) relative to H37Rv during logarithmic- and stationary-phase growth

a Geometric mean of log2 ratio from two biological replicates.
b SD, standard deviation between the replicates. The red and green boxes indicate greater (more than 0.6) or lesser (less than −0.6) fold changes in LIX11 relative to H37Rv, respectively.
c The 16 tRNA genes common to the logarithmic (downregulated) and stationary (upregulated) phases are shown in boldface.
d Significant difference between LIX11 and H37Rv (P < 0.05) (Student t test).
e Significant difference between LIX11 and H37Rv (P < 0.01) (Student t test).
