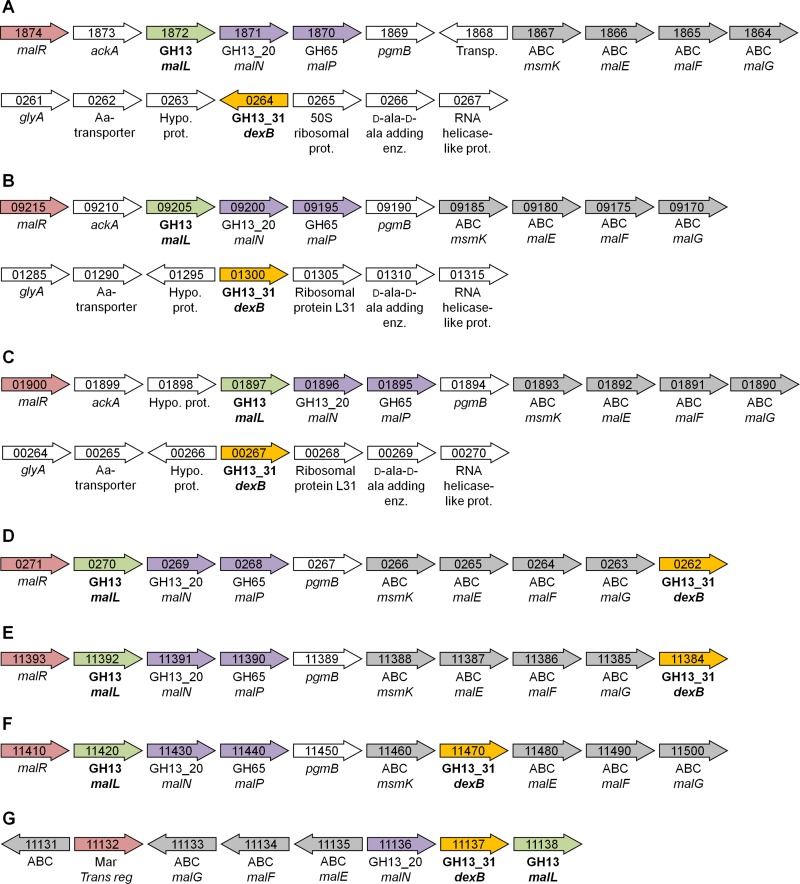
Fig 6.
Schematic presentation of the gene organization around G16Gs (yellow) and LBA1872-like GH13 genes (green) from different organisms. Transcriptional regulators are represented in red, and glycoside hydrolases are shown in purple. ABC (gray) refers to proteins, which are a part of an ABC transport system. Numbers in the arrows refers to locus tag numbers. (A) Lactobacillus acidophilus NCFM. (B) L. amylovorus GRL1118. (C) L. crispatus ST1. (D) L. johnsonii ATCC 33200. (E) L. gasseri JV-V03. (F) L. casei BL23. (G) Enterococcus faecalis OG1RF. The information in the figure is derived from the genome database provided by NCBI, and in the case of L. acidophilus NCFM and L. casei BL23, information is based on previous studies (33, 34).

