Fig 5.

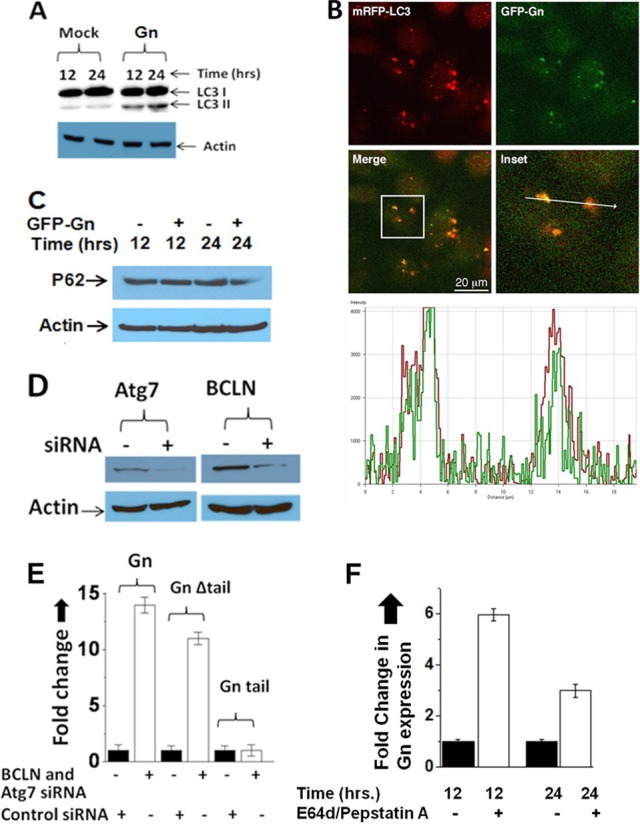
Gn degradation is mediated via the autophagy machinery. (A) Western blot showing the levels of LC3-II in mock- and Gn-transfected HeLa cells at 12 and 24 h posttransfection. (B) HeLa cells were cotransfected with plasmids expressing Gn-GFP and mRFP-LC3 fusion proteins. A confocal microscopy image shows that GFP-Gn colocalizes with the mRFP-LC3, which is an autophagy marker. The panel labeled Inset is a magnification of the boxed area in the merge panel. A line was drawn through the two puncta, and the fluorescence intensity under the line is represented in the bottom graph. The green line is the intensity of the GFP-Gn fluorescent signal, and the red line represents the intensity of the mRFP-LC3 fluorescent signal. The images were captured at 12-bit resolution; thus, the intensity ranges from 0 to 4,096. The signals for GFP-Gn and mRFP-LC3 show strong colocalization, as evidenced by the fact that both signals are significantly above the background, and both signals increase at the same location. The arrow in the inset is 20 μm in length. Similar results were obtained when Gn was expressed from a construct expressing the entire GPC precursor (data not shown). (C) Western blot showing the expression of P62 protein in HeLa cells, which were either mock transfected or transfected with a plasmid expressing GFP-Gn. Cells were lysed at 12 or 24 h posttransfection, and P62 expression was monitored using anti-P62 antibody. (D) Downregulation of Atg7 and BCLN by siRNA (as described in Materials and Methods) was confirmed by Western blot analysis using appropriate antibodies. (E) HeLa cells seeded in six-well plates were transfected with either a combination of BCLN-1 and Atg7 siRNAs or a control siRNA. At 24 h after transfection, BCLN and Atg7 siRNA or control siRNA was transfected once again together with either pTGFP-Gn, pTGFP-GnΔtail, or pTGFP-Gntail plasmid (2 μg each). At 24 h posttransfection GFP signal was examined by FACS analysis, and fold change related to the cells transfected with the control siRNA was calculated and plotted. (F) HeLa cells in six-well plates were transfected with a plasmid expressing GFP-Gn. Cells were maintained in medium either lacking or containing lysosome protease inhibitors E64d and pepstatin A. At 12 or 24 h posttransfection GFP signal was examined by FACS analysis, and fold change related to the cells lacking the drug was calculated and plotted.
